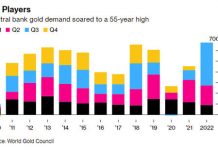
The GOLD market is not without a reason called one of the safest investments because as you can see on the monthly chart from the very beginning of its quotations it moves calmly up. As time went on and demand for this metal increased also dynamics of growth increased, which finally set in September 2011 a historic high.
Since then we have seen declines and in January 2016 reached and rejected level 1050.00.

Looking on weekly chart, we will see that price is currently close to bearish trend line. It is worth noting that although this resistance has been tested many times, never in history has been permanently defeated.

On daily chart we will note that gold market has been slowly moving north for a long time, creating a bullish channel. As a result of strong supply response on June 7th in the area around 1295.00 was formed a double top formation, which triggered declines lasting until last Monday. In this way market broke bottom of channel lasting from December ’16.
Despite the fact that these declines did not reach any significant support, exactly a week ago there was a strong demand response, which has led to a bullish impulse.

XM Broker guarantees protection against negative account balance and $ 30 start!
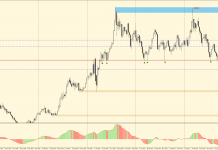
Looking on H1 chart, we can see that market has beaten and then re-tested local resistance (now support) at 1228.00. Since then, a very clear tendency of higher and higher highs and lows has been created, and each successive breakout is then tested from above (as support). So it seems that in near future we would expect further appreciation of GOLD.

Although it does not look perfect, we can notice the already-formed a inverted Head & Shoulders formation (iH&S) that support this projection. The closest resistance level we could expect to test is around 1240.50. It would be the first re-test of this level since its defeating on July 3rd over two weeks ago.


