The start of this year has been kind to gold. Since November last year when a triple bottom formation appeared at $1615/oz, the price has been moving in an uptrend. Today another maximum of this trend appeared. After reaching $1928/oz, the price started to fall and there were signals of a correction of the recent intense increases. Such a signal for me is the bearish engulfing formation we see on the H4 chart.
Gold H4 – bearish engulfing
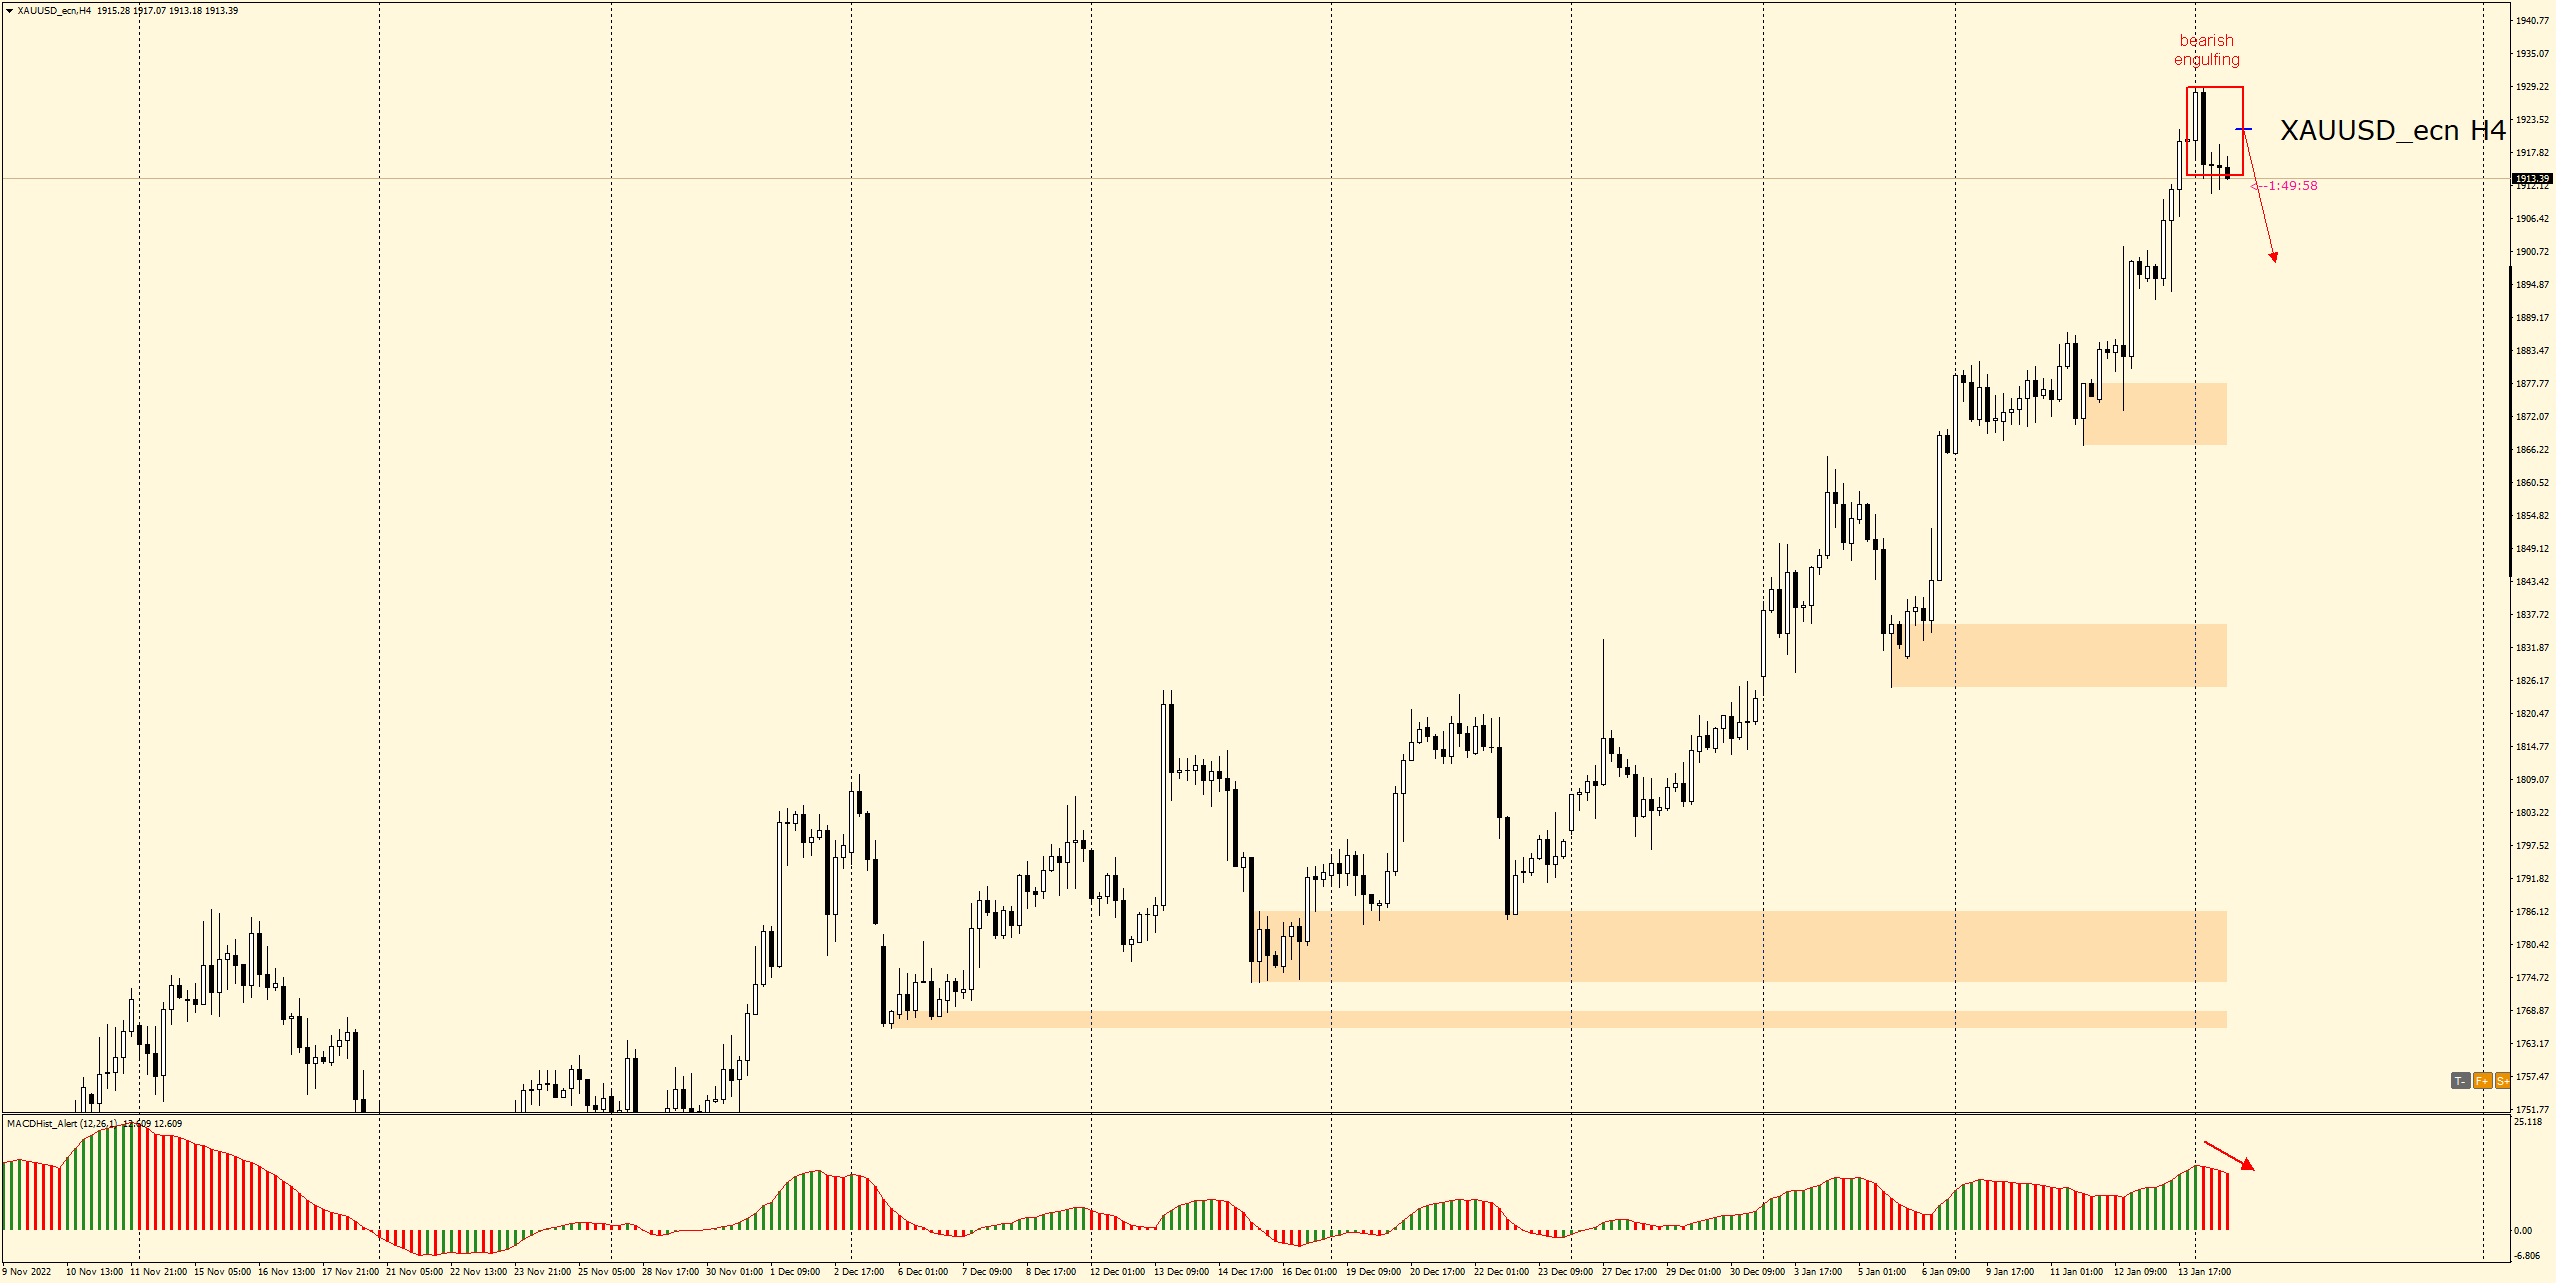
Due to M. Luther King Day in the USA it is a holiday and stock exchanges are not working, so we can only expect more significant movements during the Asian session.
Gold M30 – symmetrical triangle
On the M30 chart we can draw a symmetrical triangle. This is a bilateral formation, i.e. a breakout can occur with equal probability both upwards and downwards. However, if this breakout occurs, the price will follow this direction for some time.
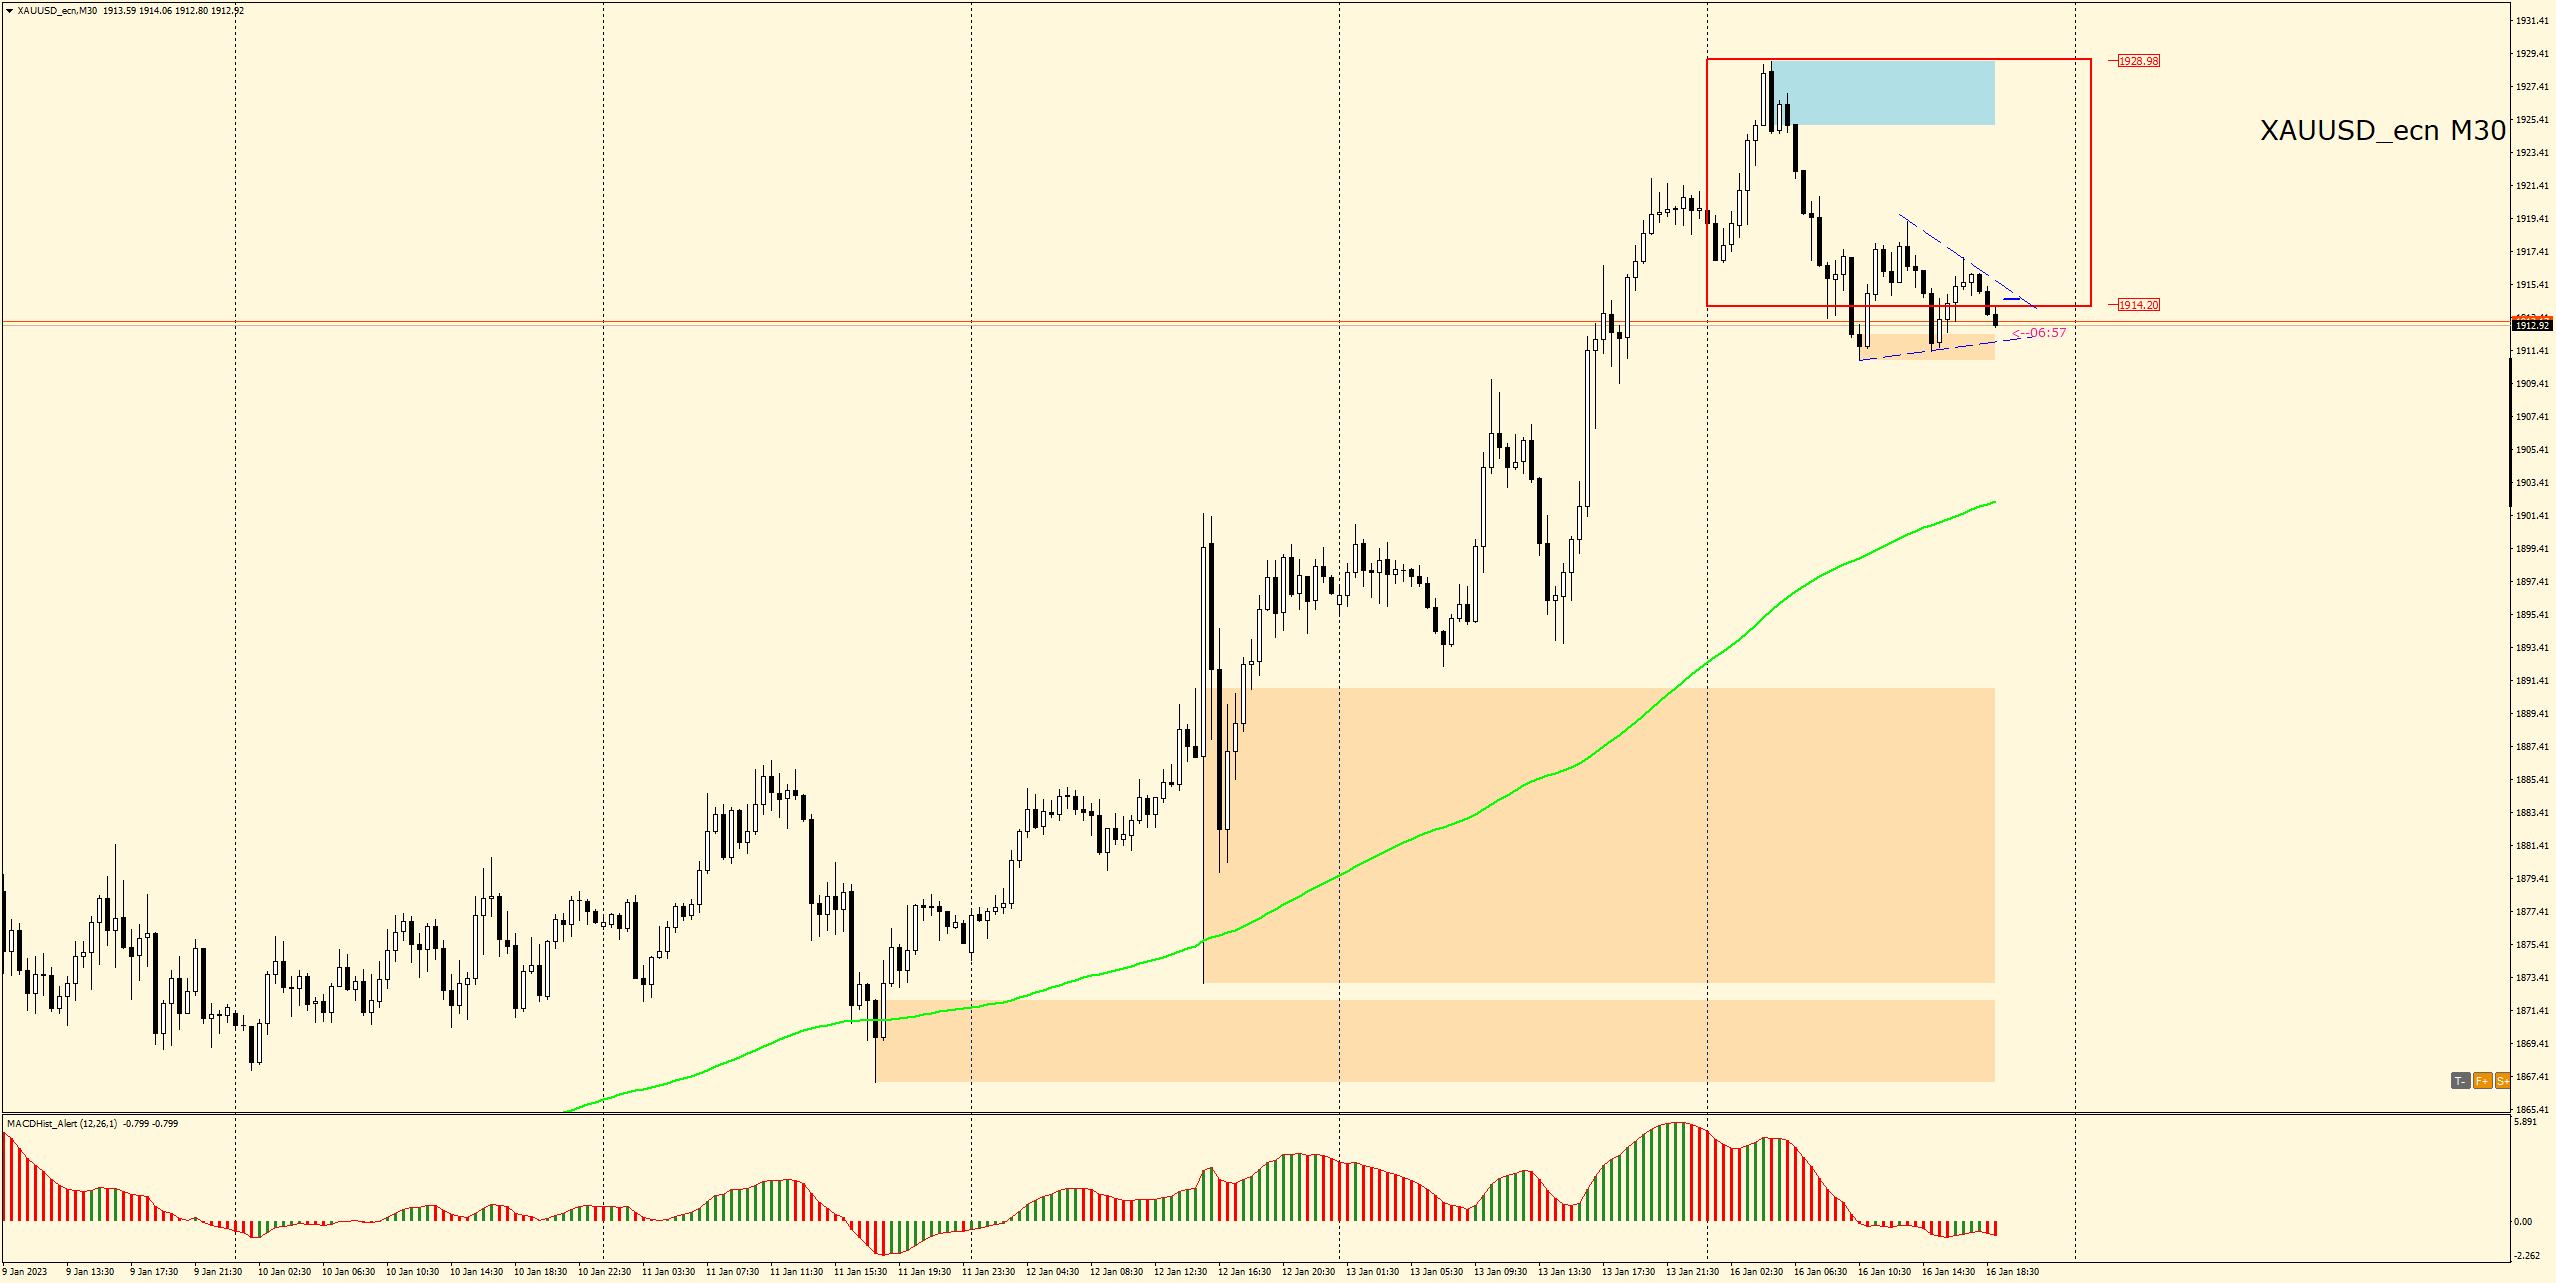
The current situation on the chart indicates an attempt at a bottom breakout. If this occurs it would be in the direction of the MACD on the charts from M15-H4 and could confirm the start of a downward correction.
LIVE EDUCATION SESSIONS
This January WEEK 3 (16-20) I am pleased to invite you to several online sessions. Below is the schedule of meetings:
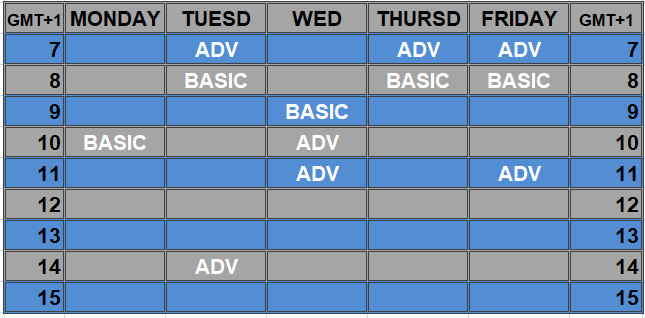 Links: BASIC (beginners room) ADVANCED ROOM
The above analysis is based on the PA+MACD strategy, a detailed description of which you can read HERE . I will talk more about the PA+MACD strategy applied to these currency pairs during the live trading sessions which you can attend from Monday to Friday.
More current analysis on the group : Trade with Dargo
 In our Facebook group, which you can join anytime: https://www.facebook.com/groups/328412937935363/ you will find 5 simple strategies on which my trading is based. There, every day we post fresh analyses of currency pairs and commodities. You can also visit my channel where I post my trading ideas: https://t.me/TradewithDargo


 Review")


