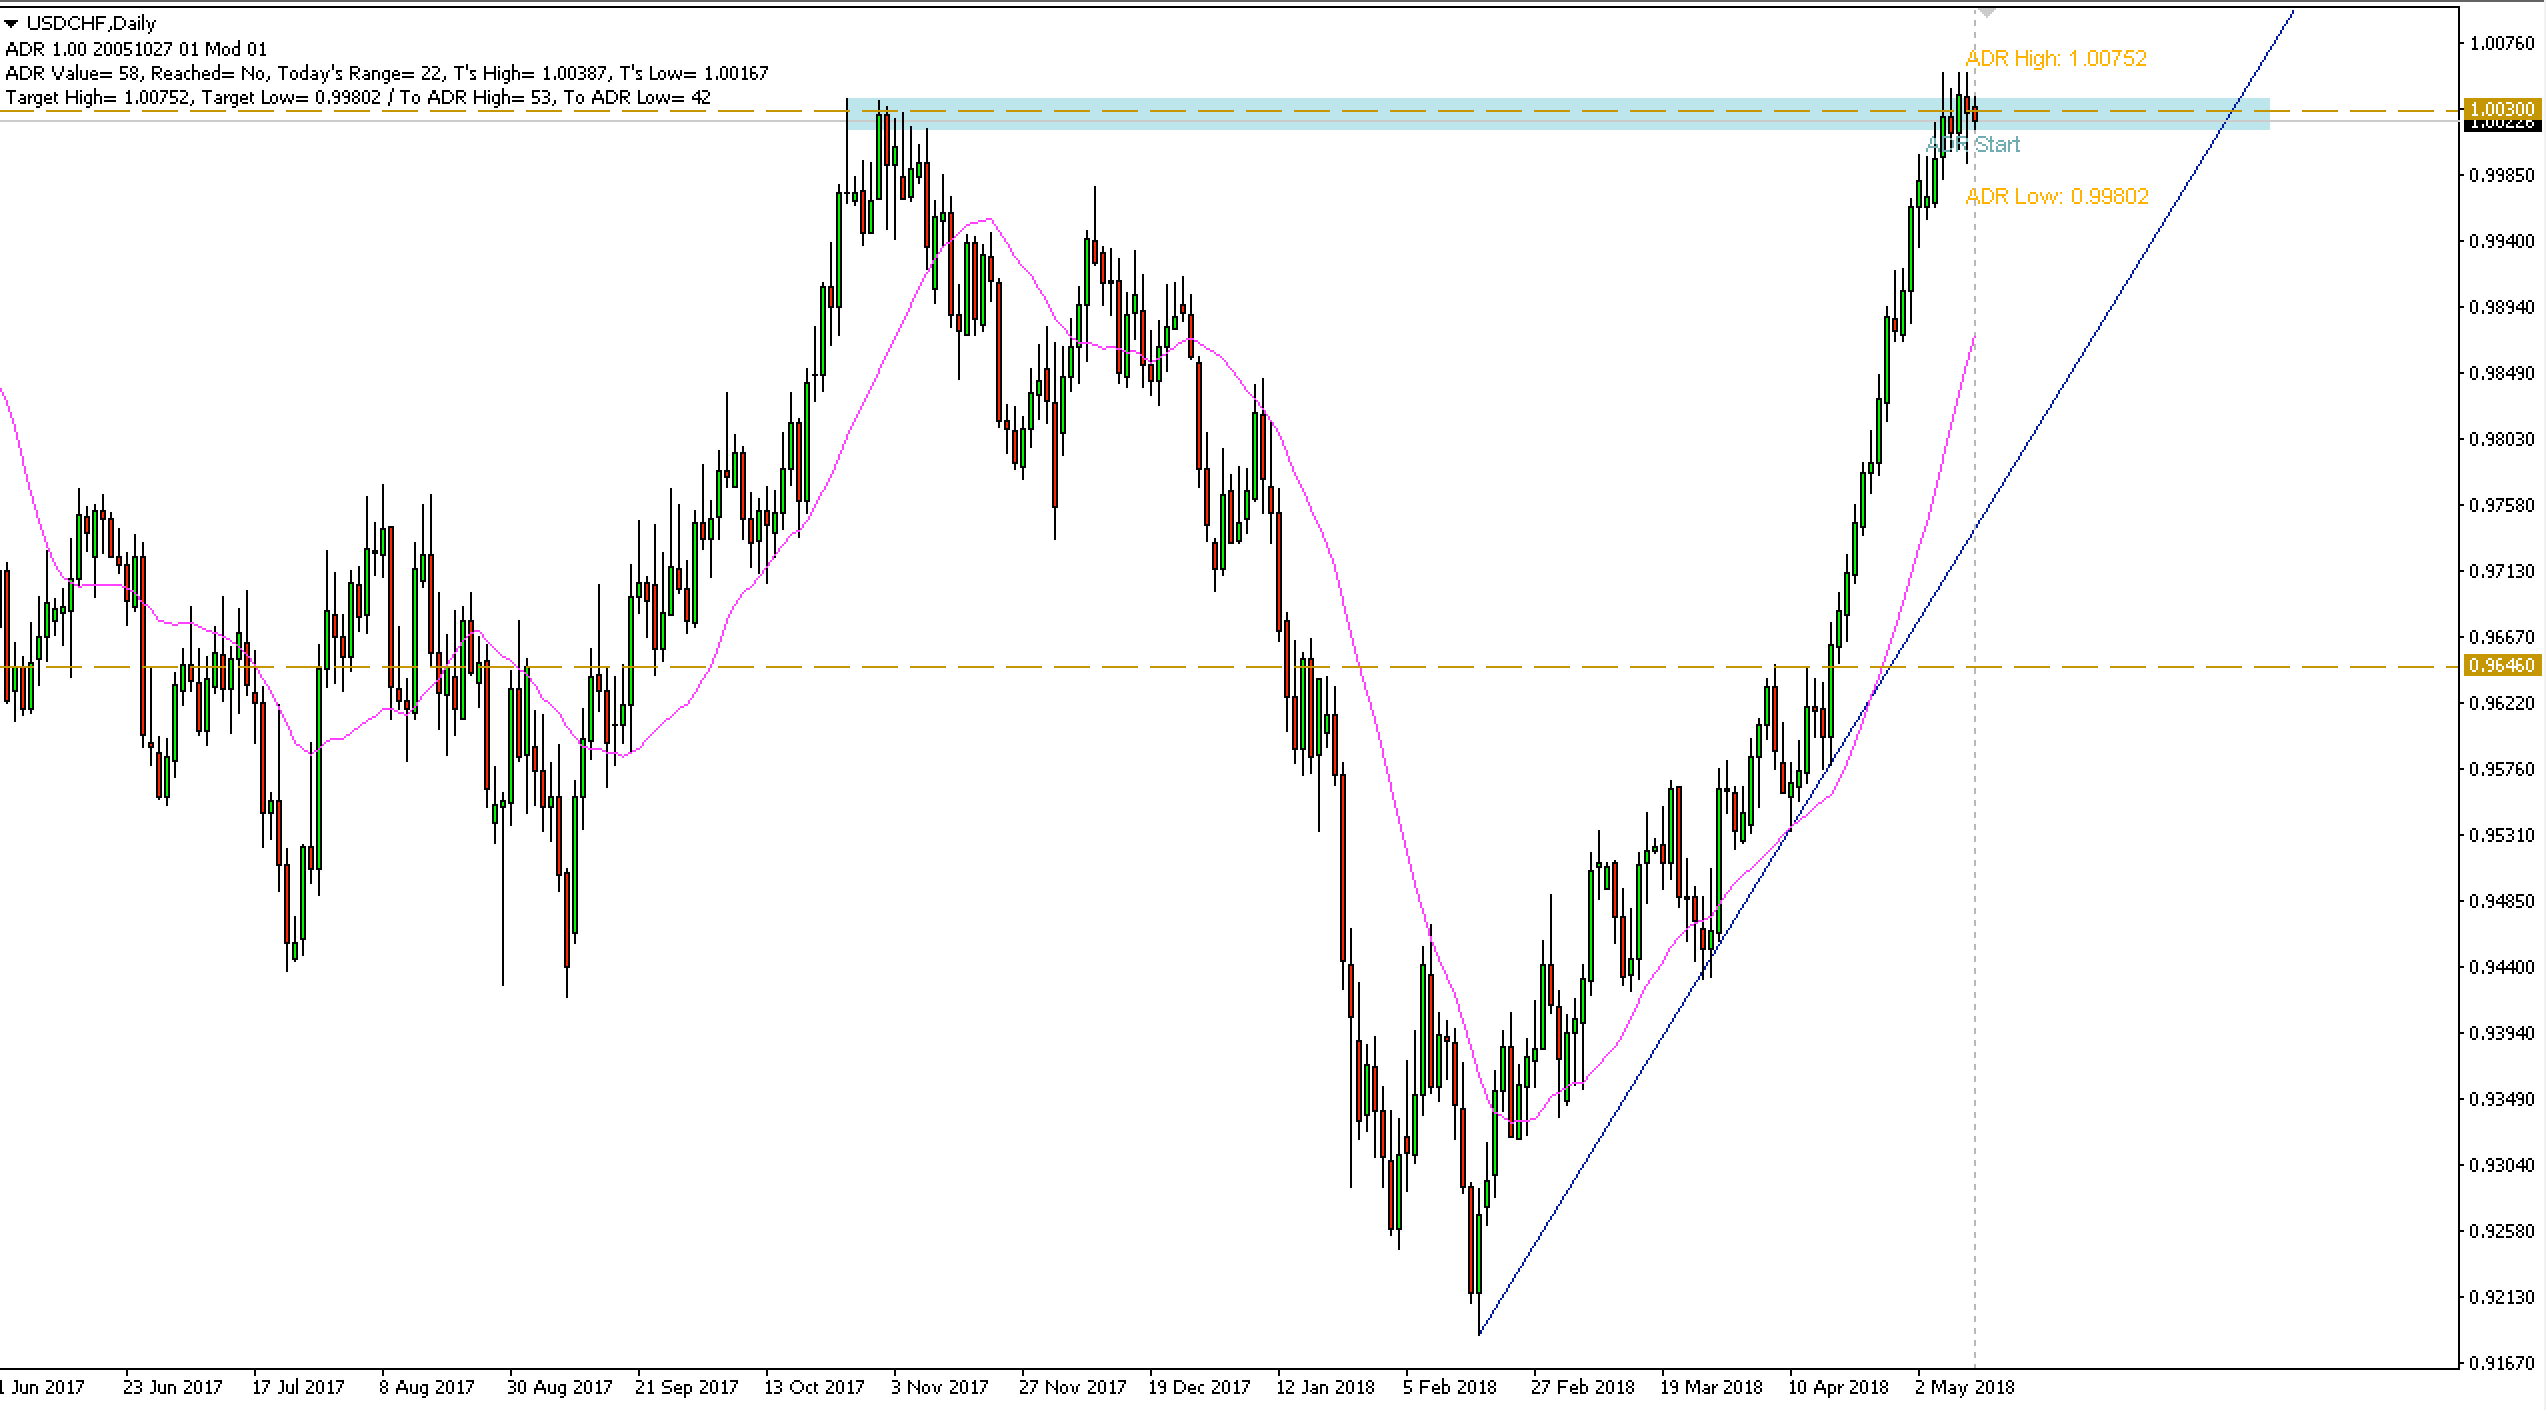
USDCHF reached this week key resistance zone around 1.0030, where the highs from the second half of last year were located. The price has arrived there on Monday and has been in consolidation since then.
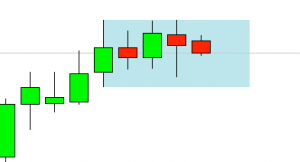
The aforementioned consolidation materializes as a formation of the inside bar on the daily chart, where the range of movement during subsequent sessions entirely covers the Monday “mother” candle.
I trade on this instrument at broker XM, which has in its offer more than 300 other assets >>
Inside bar on key resistance
 Looking at the very dynamic growth that has brought the quotes to the resistance, there is the potential to break down from the inside bar formation, which would signal a deeper correction. In such a scenario, the nearest goal for declines seems to be the 20-day average or a trend line running from this year’s lows.
On the other hand, in case of breaking thru the top from the inside bar, the quotations may continue the prevailing upward trend. Then also the resistance will be unveiled at 1.0100, where the maximum from April and May 2017 fall.


 Review")


