For 2 months AUDNZD moved in downtrend from 1.1080 level in November 2015 to 1.0535 level in January 7. Since then rebound occured, which is characterized by higher highs and higher lows (this is a basic method to identify trends). Currently price reached 1.0700 and it is likely that rebound will occur and demand will try another test of the latest resistance at 1.0830. Next resistances are located at: 1.0930, 1.1020, 1.1080. Nearest supports: 1.0700, 1.0630, 1.0550.
Wider view, time-frame W1
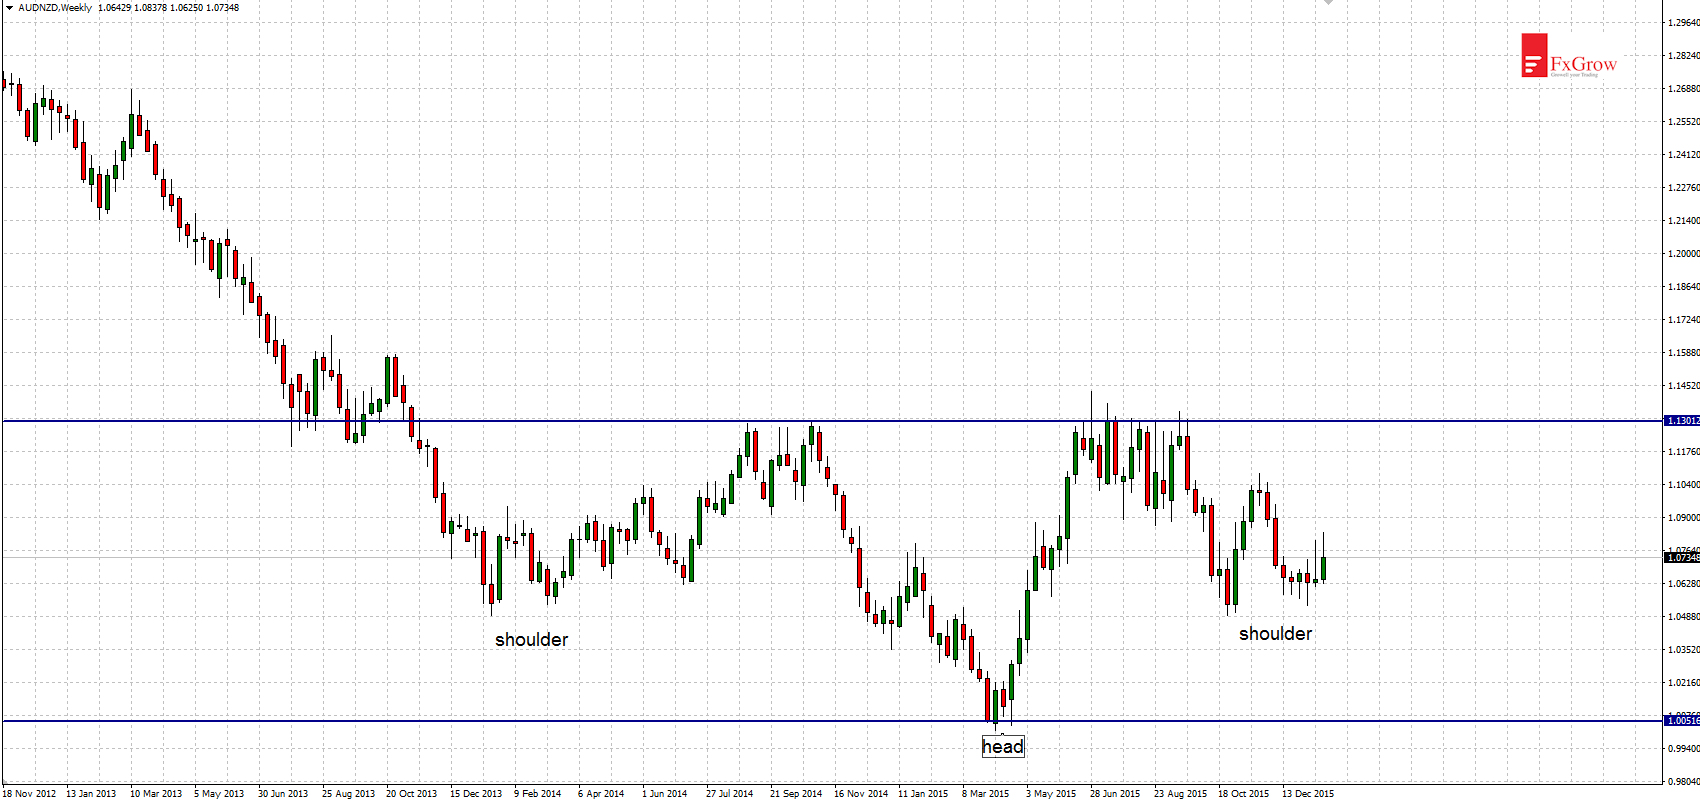
For the last two years range of movement decreased and price moved between: 1.0050 – 1.1300. However in a long term since 2011 AUDNZD moved in a downtrend. Lowest level was achieved in April 2015 and it wasn’t deepened since that moment. It has to be noted that head and shoulder pattern is forming. To complete the pattern it is necessary to permanently break above 1.1300 level – this will be a signal for a trend reversal.
Time-frame H4

Time-frame W1


 Review")


