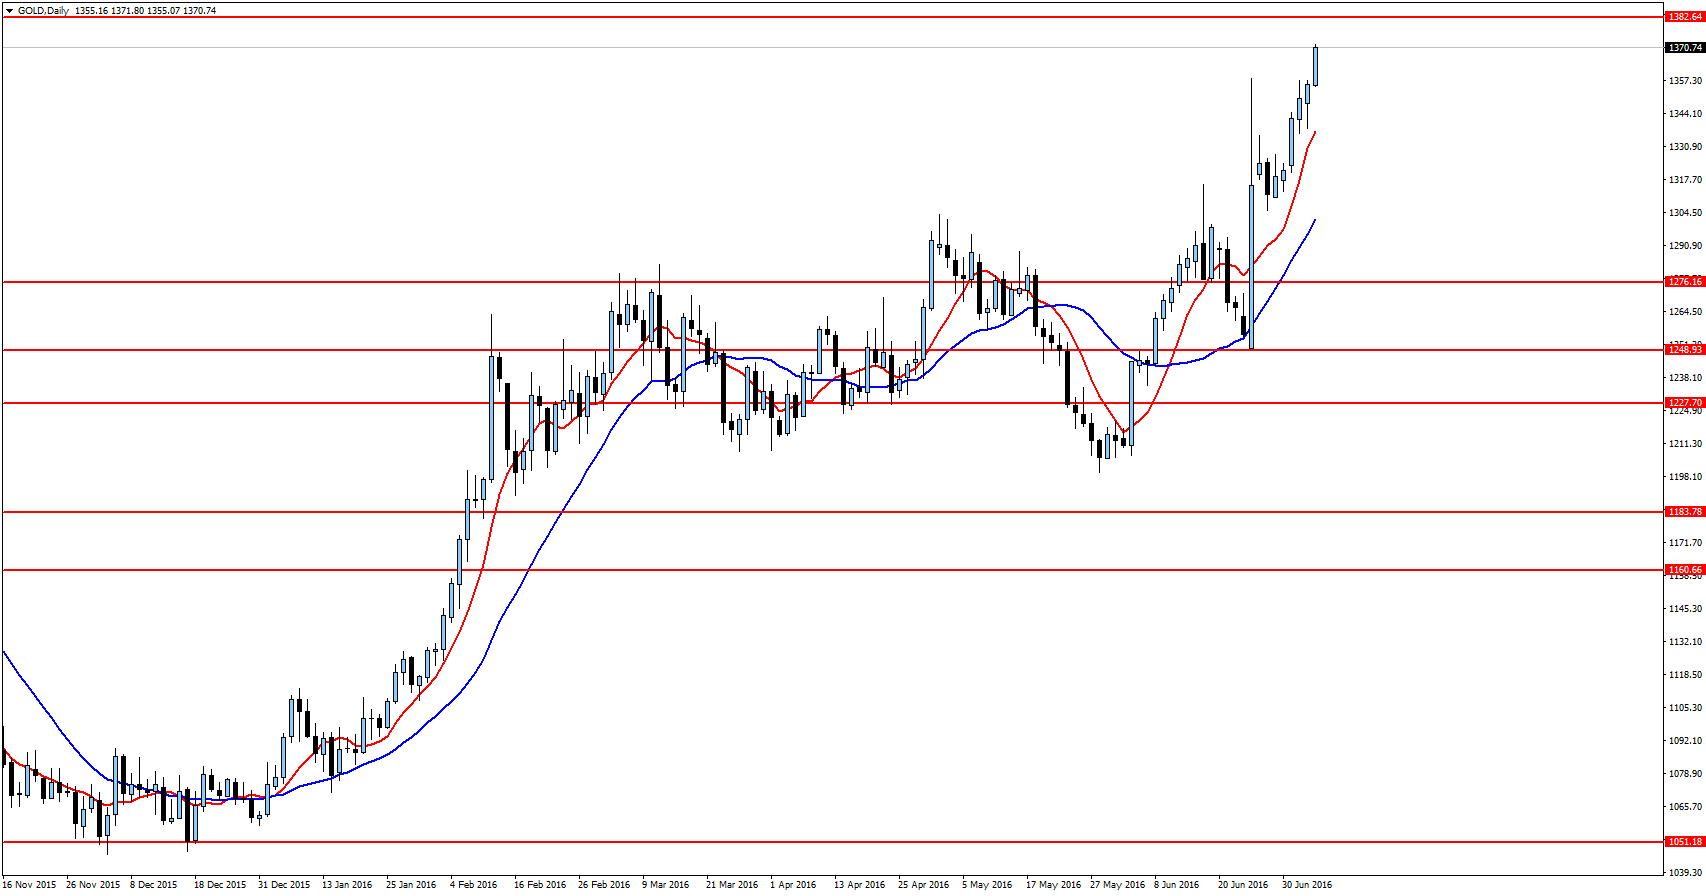
On the daily chart of gold we can see that price is in bullish trend since the end of 2015. It broke 1,275 resistance few times but then immediately came back below it. Only Brexit referendum results let to break above it currently we can see constant gains.
Price is getting closer to 1,382 resistance area where there is high from April 2014. Only 11 USD gain is needed to reach it. It seems like there will be first bearish reaction over there. Maybe there will be some kind of correction after which we can open long position.


 Review")


