AUDJPY – D1

On the daily chart we can spot downtrend. We can identify lower and lower tops and bottoms, we can differ corrections from impulses, averages have good shape, what suggests us opening short positions. We can see that price set another bottom on the chart. Then there was correction to average area. Let’s take a look at trading chart.
AUDJPY – H4
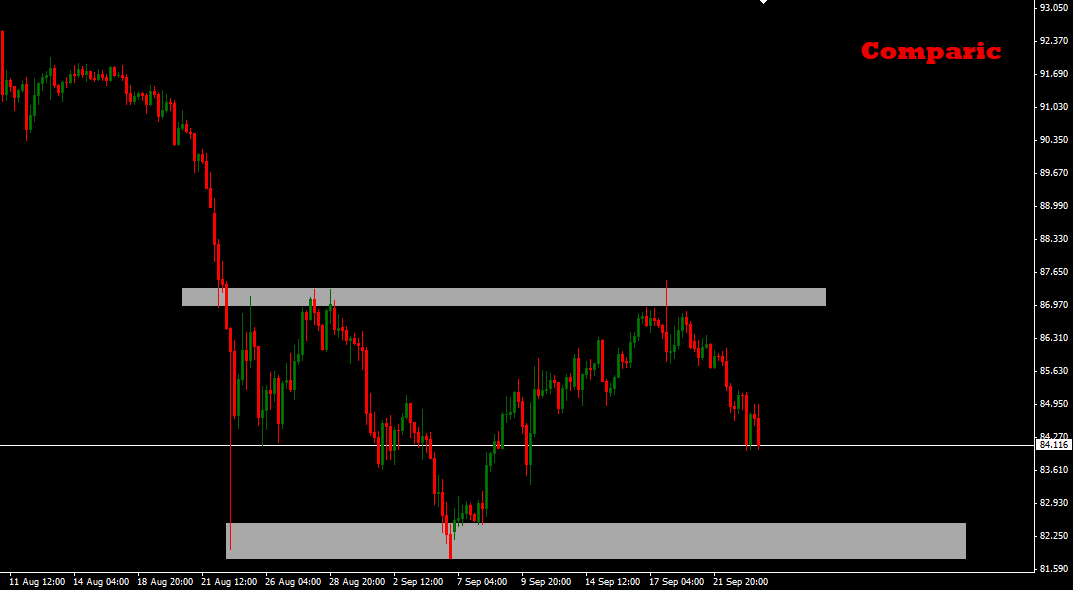
On the trading chart we can see that price tested resistance area and then bears took initiative. Traders who waited for this area could take positions in half of this level and enhance it after Pin Bar. Currently we can see that price is setting new bottoms and there are no perfect levels nearby to open positions. If the price will breach support there will be opportunity to wait for the re-test from bottom. Conservative scenario predicts taking position after candle pattern. Do not risk more than 2% of your capital. Calculate volume of position correctly. Remember about correlations with other pairs, if there will be at least one correlation higher than 0.7 (or lower than -0.7), do not open this position.


 Review")


