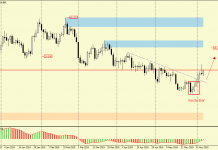
August does not spoil us with the amount of irregular corrections – so important when we use Elliott Wave trading system. In the last two weeks we have only dealt with one – today we will closely look at the second. EUR/CAD chart drew a five-impulse in south direction. Then added a new wave, potential, irregular correction B-wave. A-wave reached the fourth impulse and had three-wave structure. The first wave is equal to the wavelength of the fifth. 1.4750 level is a limit border (in the case of B-wave). Price chart here turned – if it still will be heading up, then we have to deal with a C-wave. Its range coincides with the 68.1% retracement of the downward wave.
This area is also strengthen by resistance zone and it seems like a good place to take a short position with stop around 50 pips. The minimal risk-reward will be 3:1 (if TP is set at 1:1 compared to the first decreasing wave). Maximal RR – resulting from the third wave range – will be 6:1.
We should closely observe marked on the chart level and price action in its vicinity. There is a certain danger for mentioned structure. Before falling in the form of impulse, we had a increase followed by a correction and rapid movement which broke the high. It is possible that the current decline is a part of larger irregular correction structure in the opposite direction than discussed. Everything should be clearer soon.
One last screen for the end – it shows us from where the level that strengthen area of potential entry come from.
I encourage you to familiarize yourself with other irregular corrections which occurred in the past and Elliott Wave strategy guide.


