Summary of the 26th week of 2019 – how the theory (analysis) worked in comparison with reality (market) ?
In the first analysis of this week: “AUDUSD – bullish divergence on D1” I predicted growths. I based my forecasts on a strong growth divergence on a daily chart and partly on information from the RBA indicating the willingness to continue the current monetary policy, which the market accepted as a positive signal for the Australian currency.
AUDUSD 24-28.06.2019

I wrote so: “Turning to the chart on the lower H4 interval, we can determine the potential Take Profit and Stop Loss levels. If the price follows the divergence from the daily chart, the demand target can be 0.7000, where the nearest supply zone is located…“.
On the chart above we can conclude that the objectives set out in the analysis have been met. It is also worth noting the two red Inside Bar patterns. In both cases there is a negation of an important level, which leads to a dynamic breakout.
EURAUD 26-28.06.2019
The second analysis of the past week was: “EURAUD -Bullish Engulfing and Inside Bar on Daily – 26.06.2019 ?”
 I predicted a drop after the breakout from an interesting pattern that the market had drawn in the preceding days – “…the daily candle turned out to be the “mother candle” for the next few days, creating a double pattern: bullish engulfing for the preceding candle and Inside Bar for the next two days. As usual in such a situation, the form and direction of the breakout from the IB will be important for the further fate of this pair. Currently, the price is below the bottom edge of the IB, which may suggest further decreases. The declining scenario is supported by bearish divergence on the MACD chart.”
Since not much time has elapsed since the analysis, the implementation of the declining scenario is still in progress. So far, the price has come out of the IB and dropped by 100p almost reaching the first target. As long as the Daily divergence continues, we can expect further declines next week, preferably after some upward correction.
USDCAD 10-29.06.2019

As it is the end of the month, I will also summarize the analysis of the currency pair “USDCAD – possible long squeeze?” from the beginning of June. The drops today reached the goal I set in this analysis… but before that happened, we had a book example of a re-test of the defeated trend line accompanied by the formation of the Bearish Engulfing followed by sudden drops.
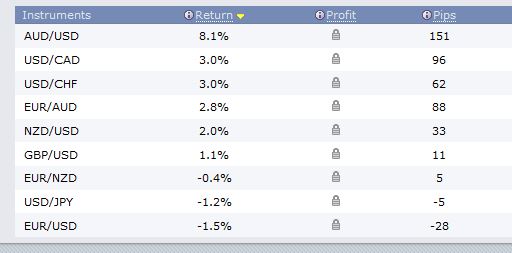
Pips earned in June:
 In our Facebook group, which you can join anytime: https://www.facebook.com/groups/328412937935363/ you will find 5 simple strategies on which my trading is based. There, every day we post fresh analyses of currency pairs and commodities


 Review")


