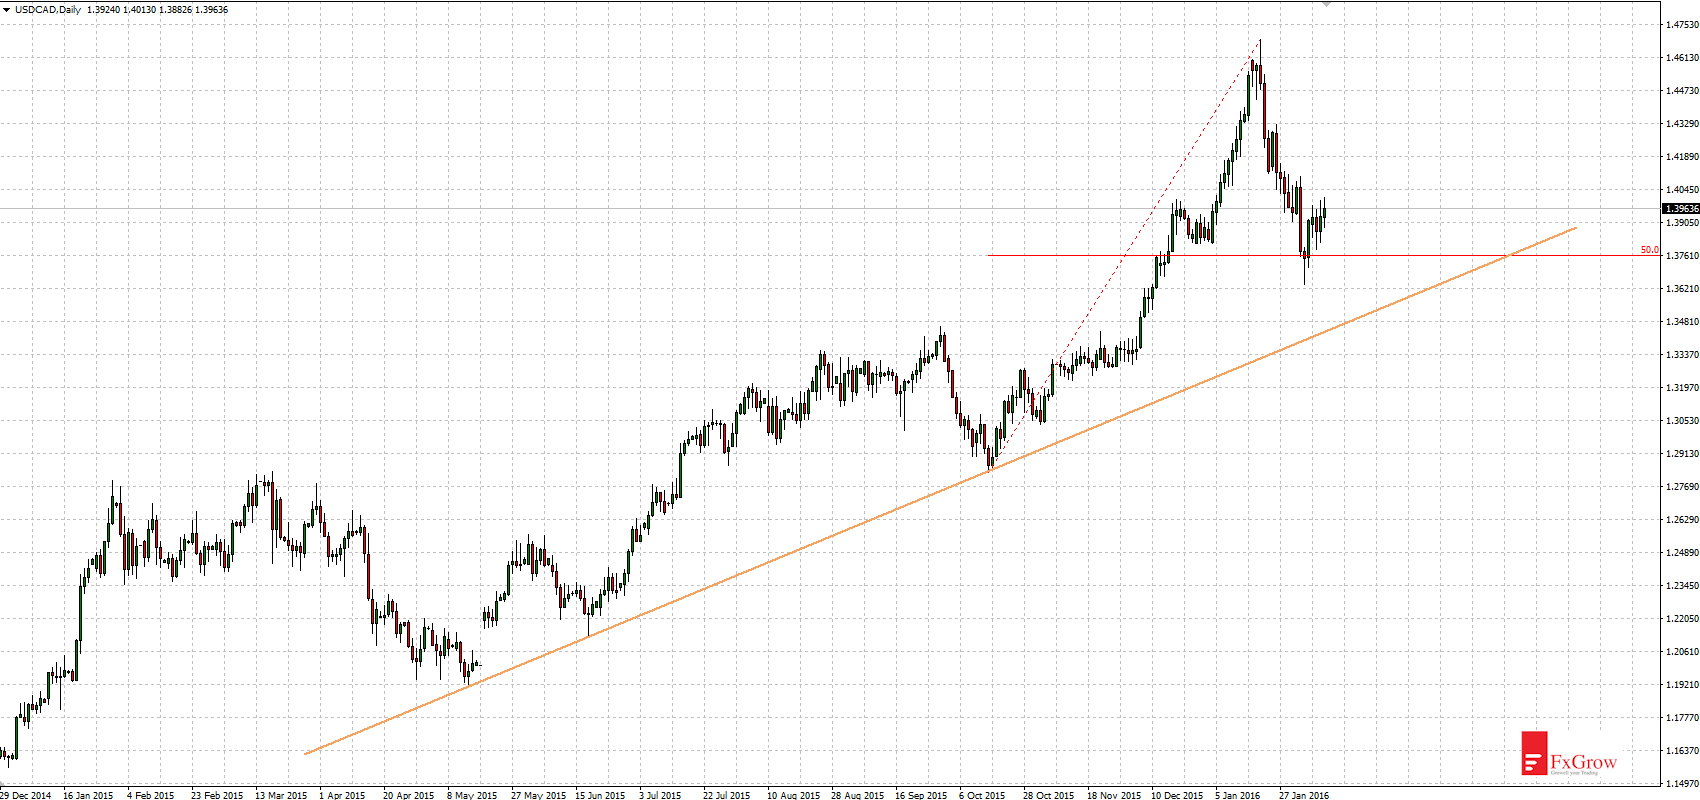
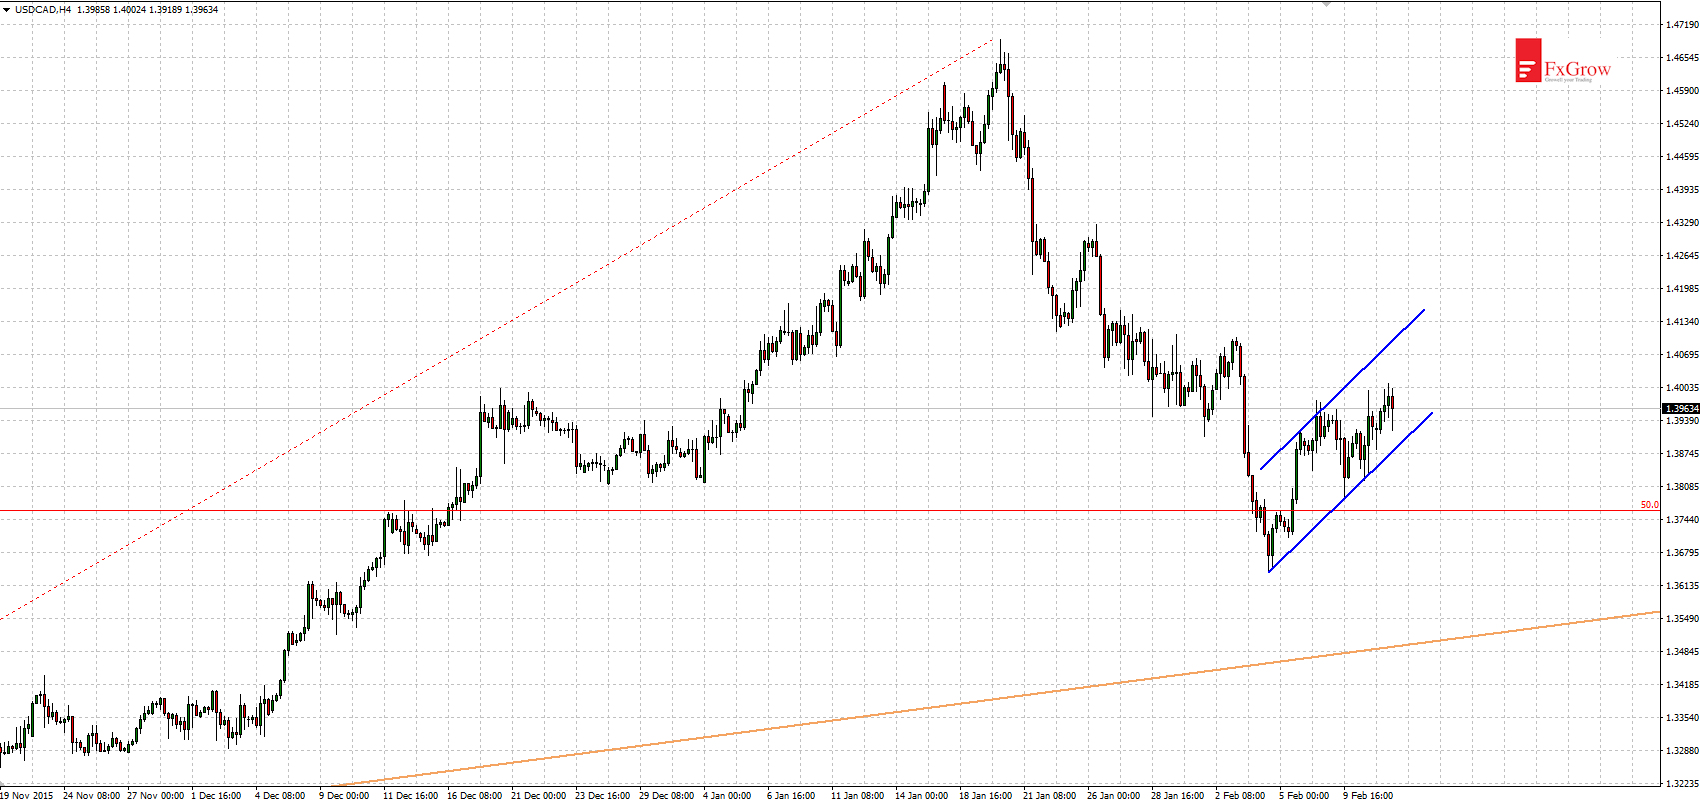
After correction of 50% previous upward movement, at the chart occurred a candle with long bottom shadow. Such price action candles predict rebound. So it happened and for a week upward movement continues. However there is one concern. At time-frame H4 price formed flag pattern in a direction opposite to the previous movement (blue on the chart). Flag pattern like that usually is break below and it is likely that previous downward movement will be continues. Scenario of downward movement may be connected with test of uptrend line (orange on the chart).
Time-frame H4
Time-frame D1