At the H1 chart USDJPY can be observed upward trend evidenced by the recent highs and lows. An additional tool to help determine the trend are the moving averages EMA on H1 (75- and 100-periodic) chart, which are directed upwards. According to our latest analysis pressure of demand led to growth impulse that tested resistance around 104.50. Currently, the price corrects the latest upsurge.
You can see that the price has tested the 61.8% FIBO (measured from the low of 10/21) and area of the support level of round number 104.00. The graph also produced several growth hammer formation, which increase the likelihood of completion of the correction. The increases, which will be combined with the increasing volume will increase the chances of breaking strong resistance 104.50. Support is the aforementioned level of 104.00.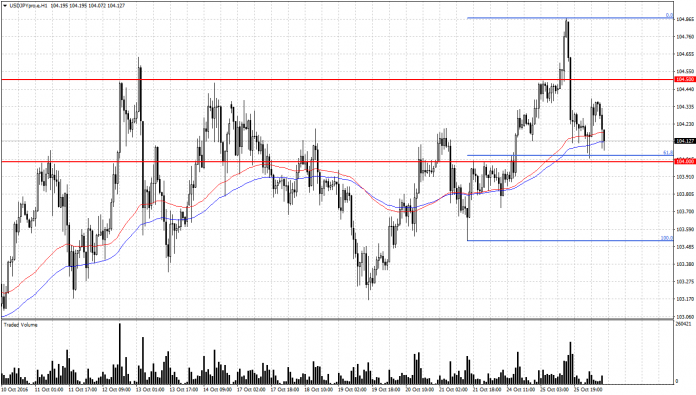


 Review")


