GBPCHF reached a significant resistance area of 1.3055 last week. As can be seen in the daily chart below, just on this resistance the rally stopped, and the price was not able to continue to stick to the outer Bollinger band.
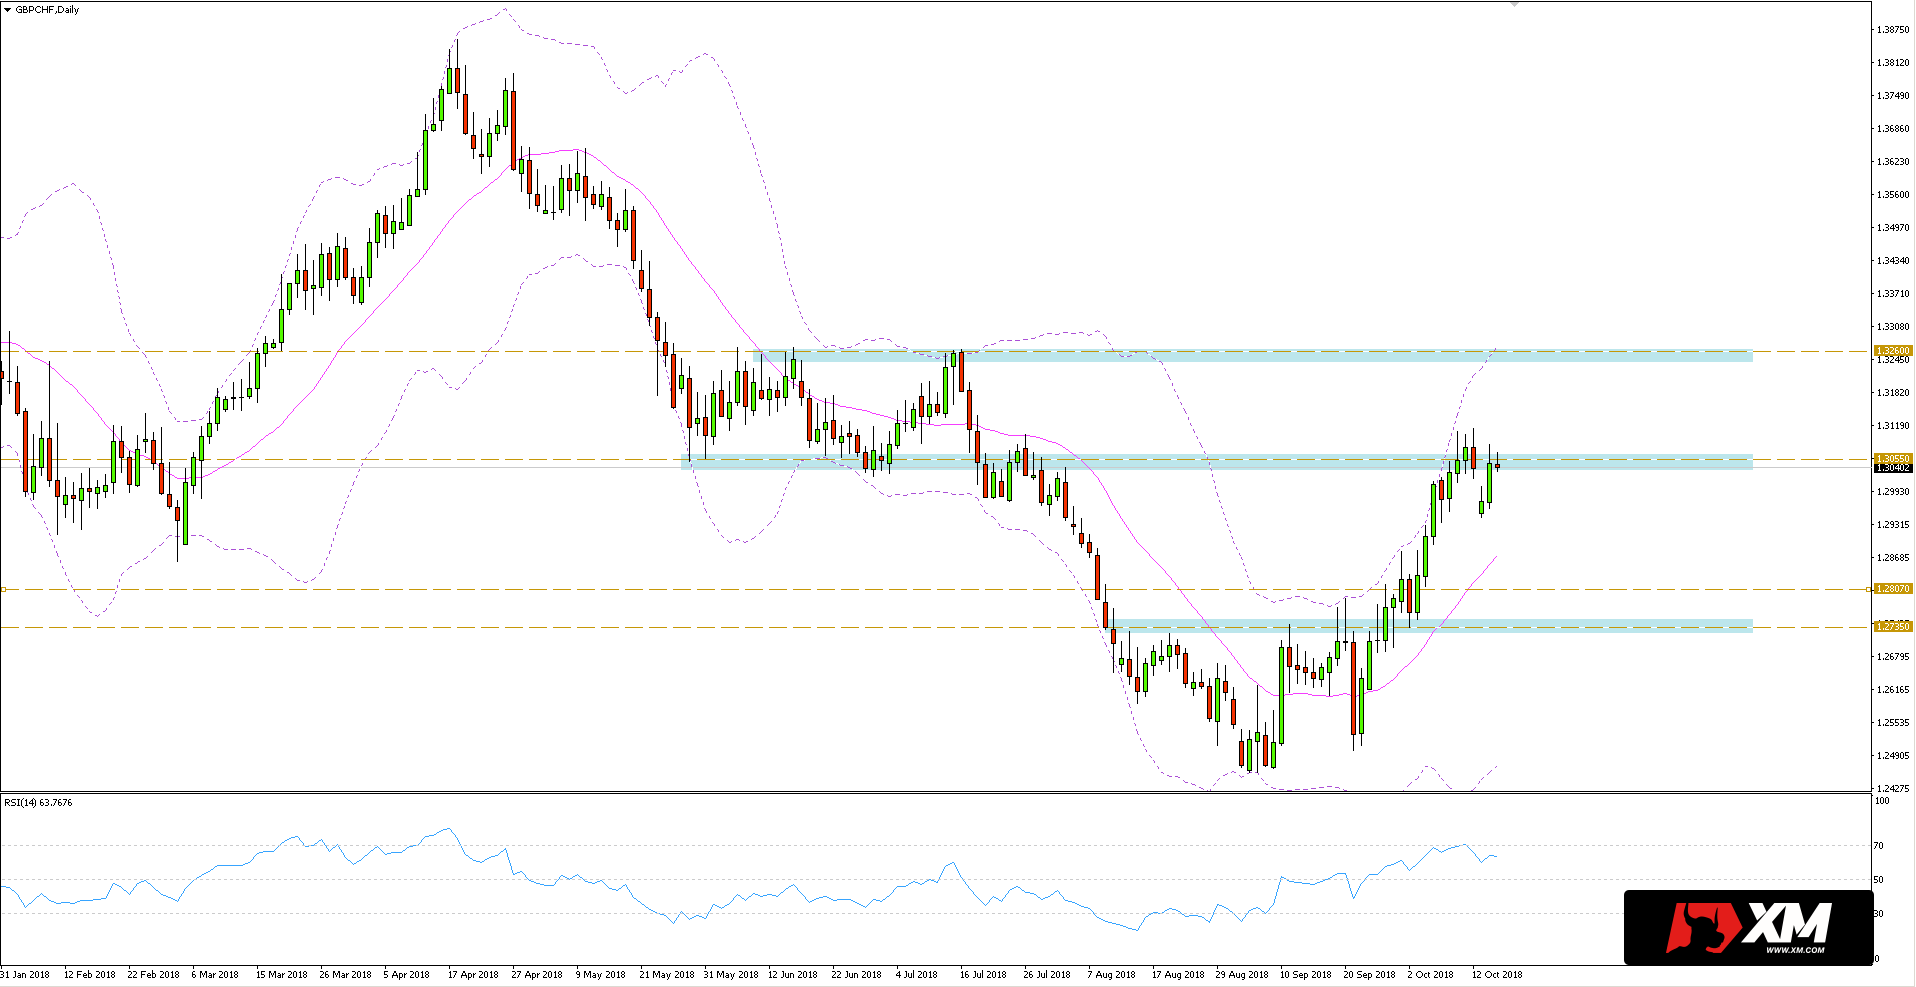 In turn, the 4-hour chart shows the divergence between higher and higher price peaks, and the downward-trending RSI. This is another sign of the weakness of the bulls on resistance.Considering the above, if the key resistance within 1.3055 breaks under the pressure of the sellers, a deepening of the correction is expected. After breaking the last local low at 1.2944, the supply side can direct the quotes to 1.2807, where is the 50% abolition of the last upward impulse. A little lower is the horizontal support within the level of 1.2735.


