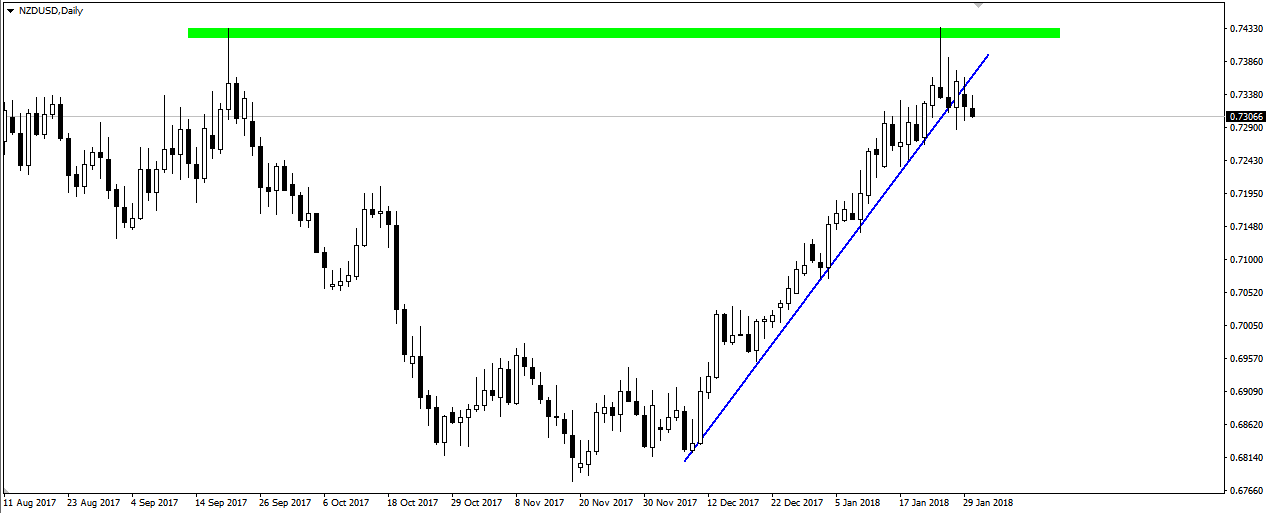
Quotations of NZD/USD look very interesting in the last days. On H4 chart price indicates breaking of the upward trend line, which was very carefully respected. Until then, breaking the line itself has no major consequences. The situation will start to get complicated when it goes below the lowest point after breaking. Then the supply may increase its activity.
 The layout on the daily chart looks interesting too, where the price after the unusually strong rise stopped almost at the level of the September high. At that time a large bearish pin bar candle was created, suggesting declines. Movements of the price from the following days showed that such a scenario is in tact.
I trade on this instrument at broker XM, which has in its offer more than 300 other assets >>
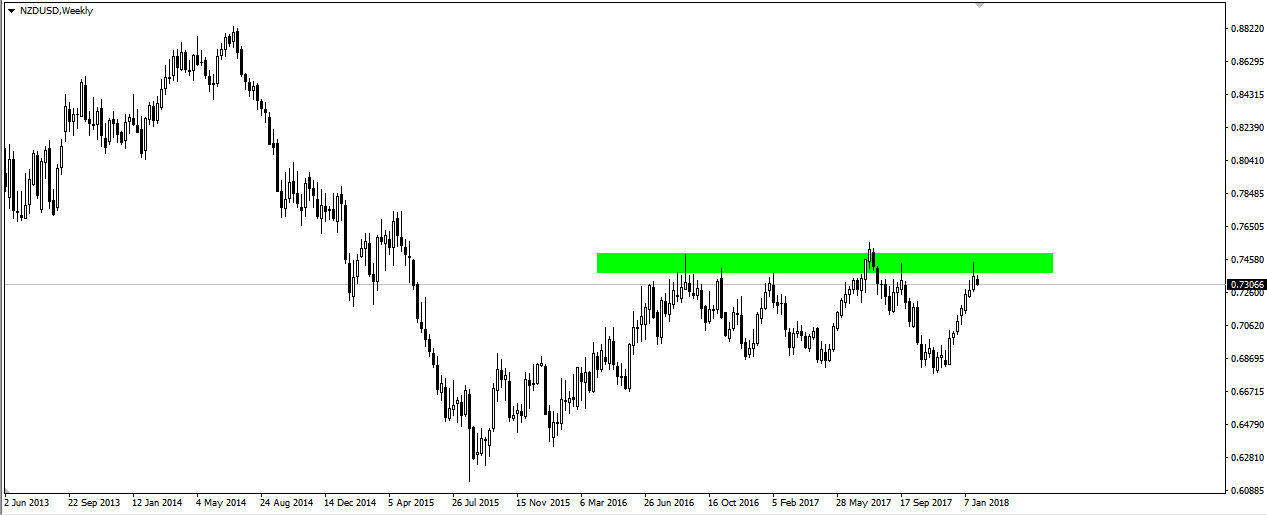
 It’s worth looking at the weekly chart, where it can be seen that the current level represents a zone of resistance. This chart also shows that the long, protruding shadows of candles often ended the swing. If history repeats itself, it is possible that we will have a period of declines.