During the last AUDUSD currency pair analysis, pair was was on support at 0.7500. It was also at that time that I mentioned the potential for corrective action towards the confluence of the resistance created by the trend line running from the 2016 low and the horizontal level close to 0.7665.
Such a correction actually took place, and the resistance was successfully tested, as a result of which a candle with a long upper wick formed on the weekly chart indicating the advantage of the supply side.
I trade on this instrument at broker XM, which has in its offer more than 300 other assets >>
As can be seen in the weekly chart below, after the above-mentioned candle there was a dynamic downward movement, which led to breaking the support at 0.7500. The next target for the declines was the defense area within 0.7330.
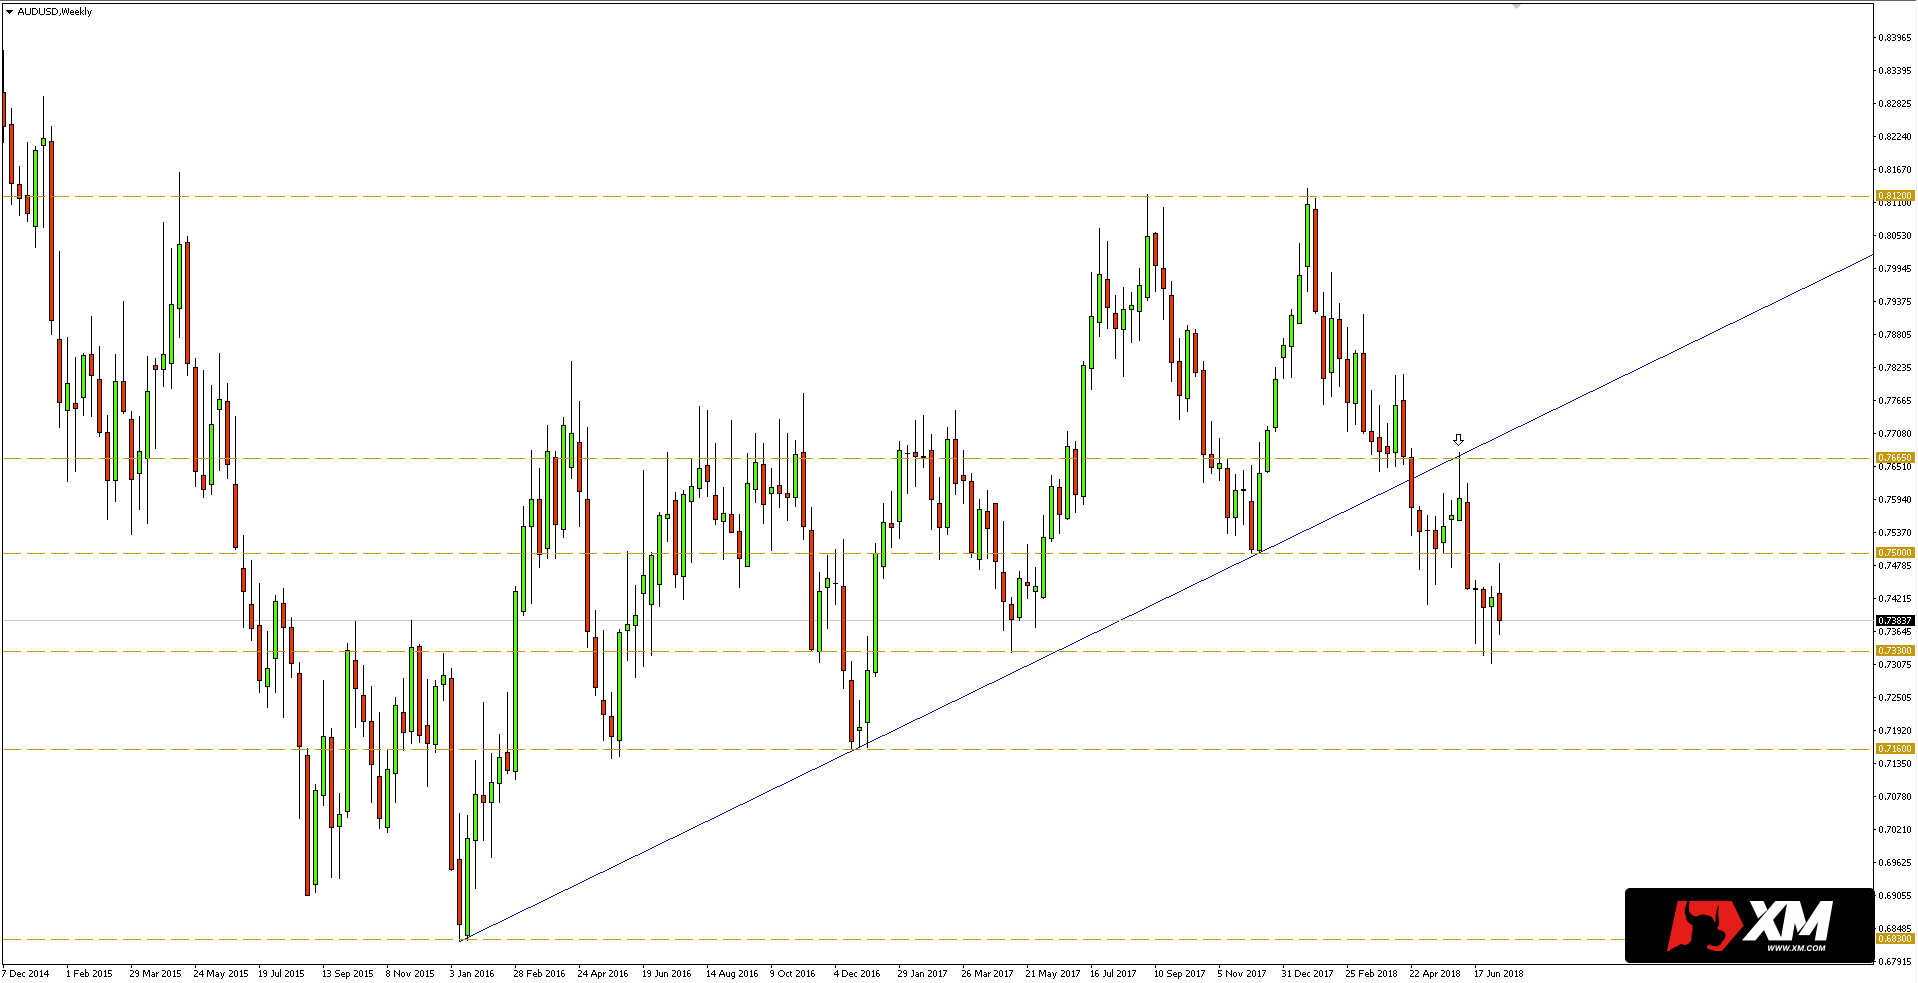 For several weeks, the support zone at 0.7330 has been tested, and subsequent tests prove to be positive. In addition, the southern direction is currently dominating, and therefore further declines are expected only after breaking the support / minimums from last week. Then, support for 0.7160 will be unveiled, which last time stopped sellers at the turn of 2016/2017.


