EURGBP in the first week of this month broke the upward trend line running from the low of June 21st this year. At the same time, horizontal support in the vicinity of 0.8950 was overcome. As can be seen in the daily chart below, after the breakdown, the price went down for two more days and then the consolidation started. The mentioned consolidation is nothing else but the inside bar formation, where the trade for 4 days in a row took place in the range of Tuesday (11/09/2018) session.
Today, however, we are witnessing an attempt to break down from the formation. The price broke Tuesday’s minimums, however, currently it is back in the IB formation.
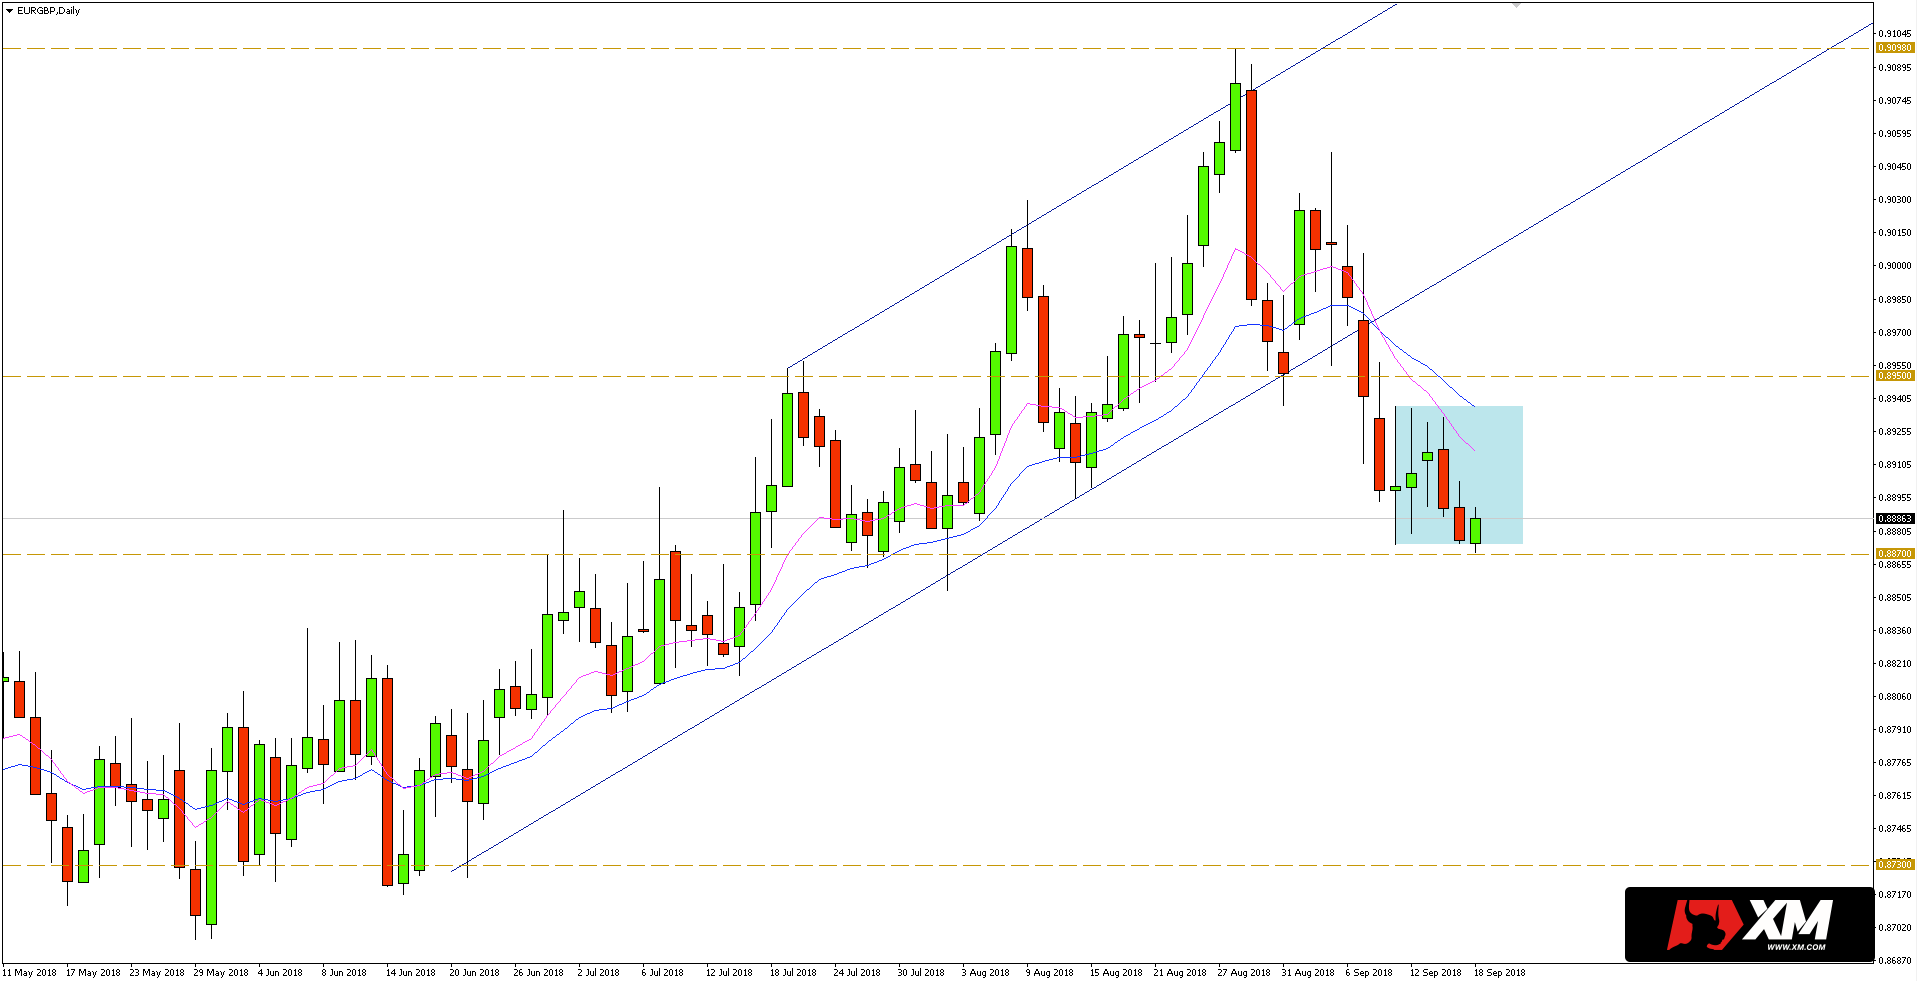 A false break from the inside bar may result in an opposite movement towards 0.8950. On the other hand continuation of declines is expected if the daily prices close under the minimum of formation and support at 0.8870.


