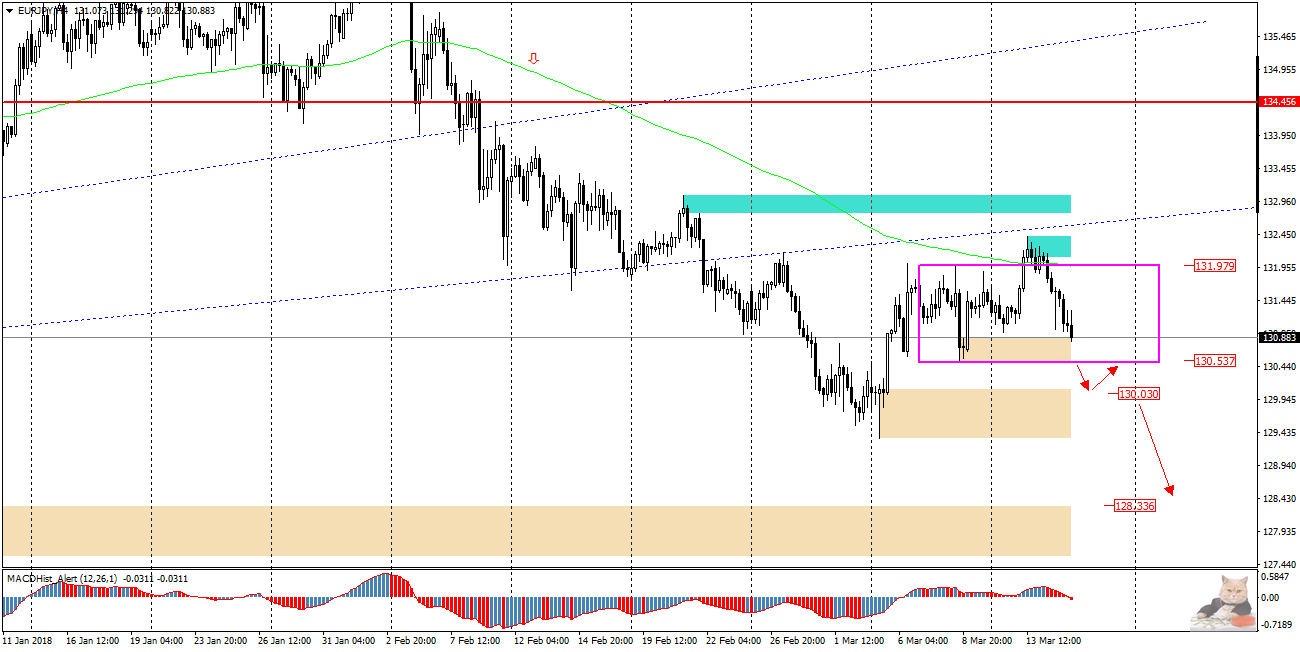
EURJPY moved in the ascending wedge from August 2017. On 7.02 this year had overcome its lower limit and began dynamic declines. The price reached 129.30 where an upward correction began. The candle from March 8 creates until today an Inside Bar from which we already had two attempts to break the top, both of them failed. Such a false break out may indicate a dominance of supply.
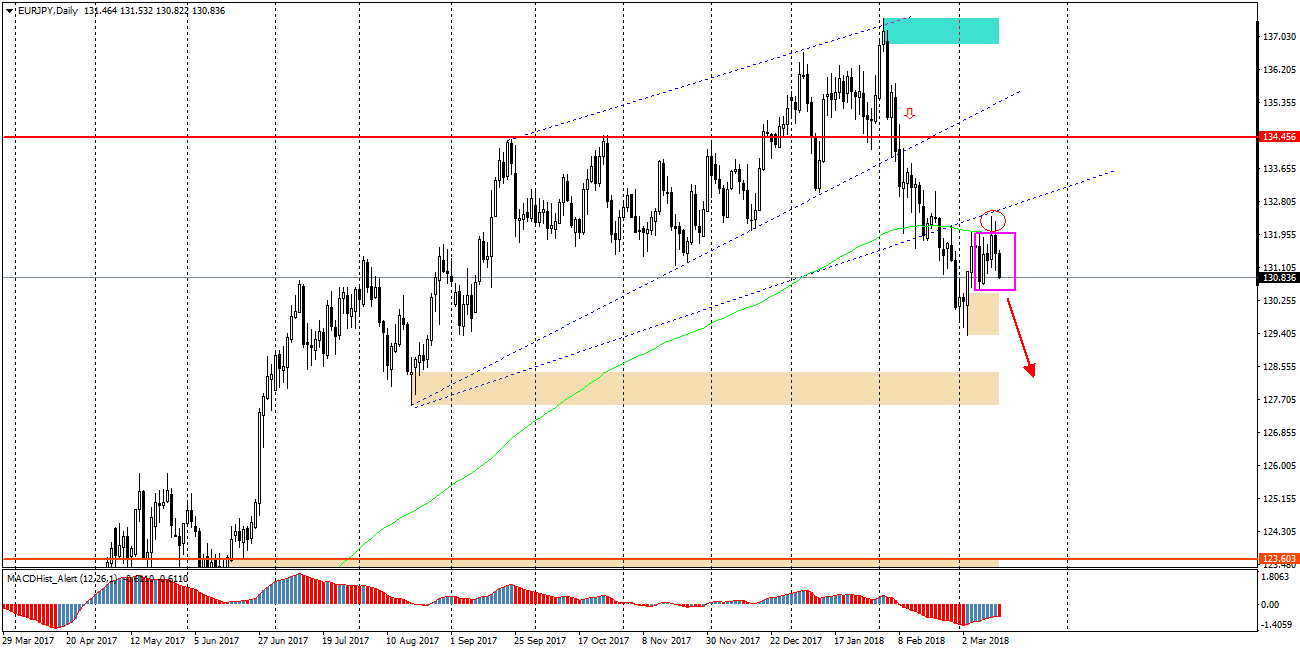
The downward scenario becomes more likely than upward and may follow the pattern in the chart below. The closest support zone can be 130.00 and than possible correction to the lower limit of IB 130.55 . Further declines can lead the pair to 128.30. A possible attempt to break the top of IB can restore the desire for growth.