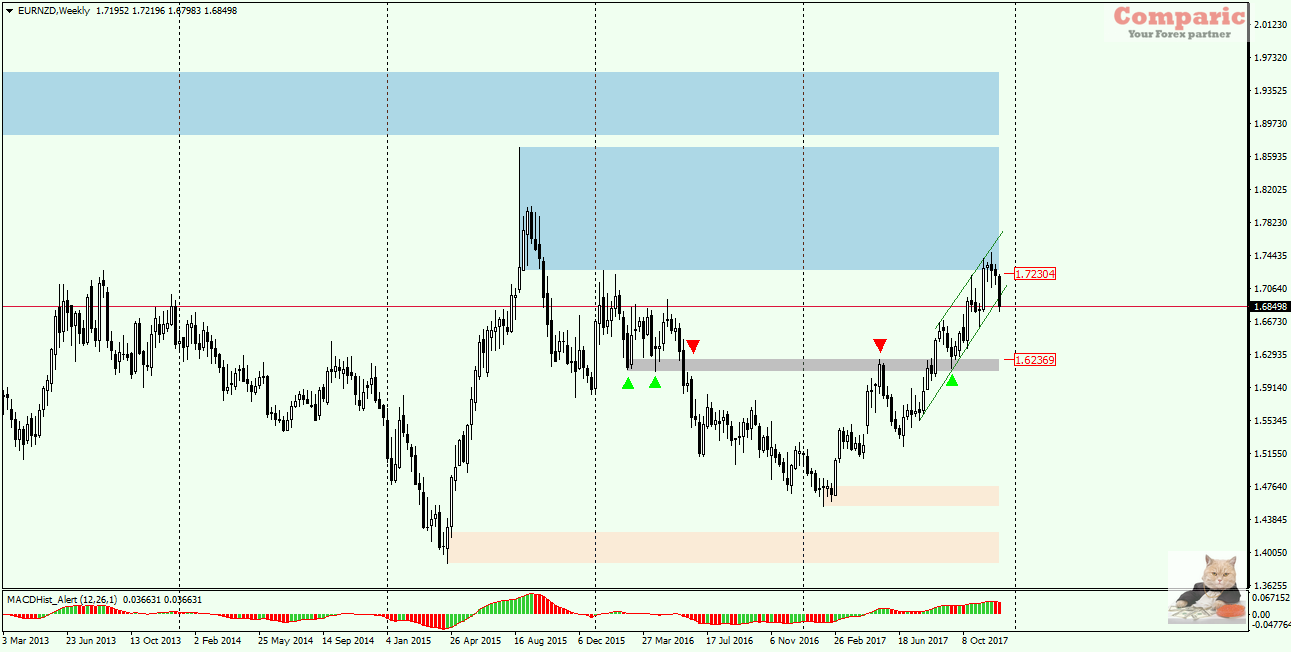
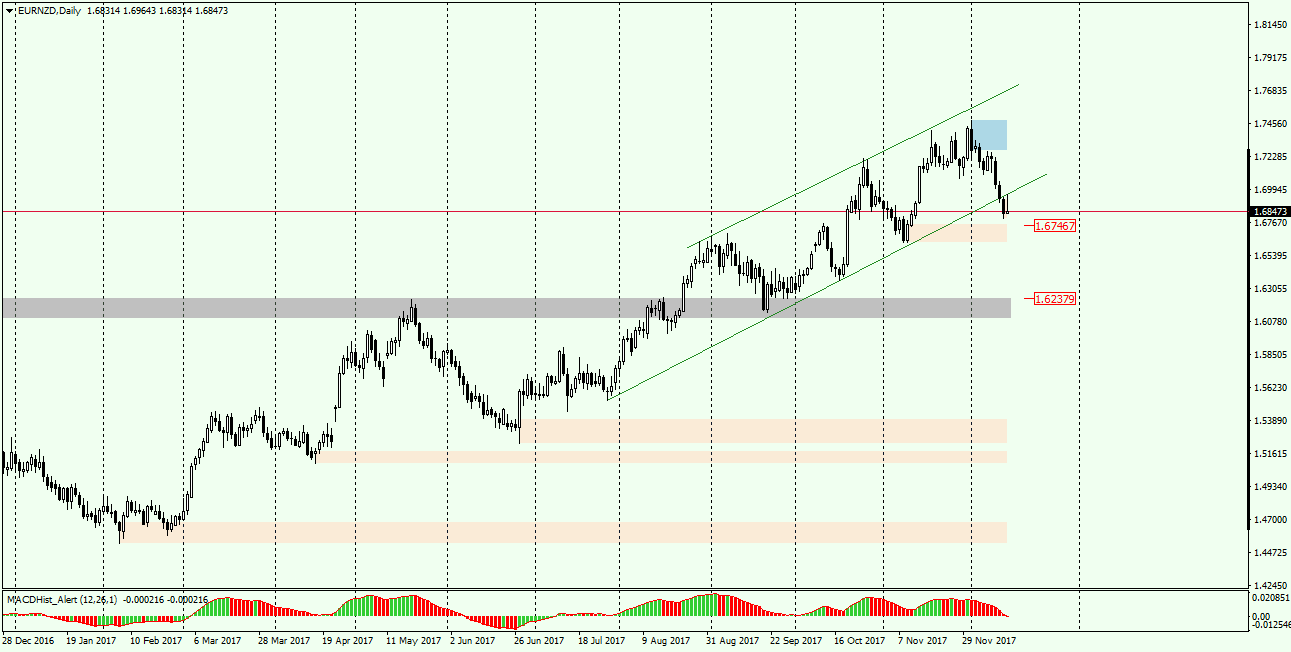
EURNZD – situation on this pair becomes more and more clear. The pair has been growing since the first days of February this year, and since July it has been moving in a growth channel quite closely respecting its lower and upper limits. On Tuesday, the price left the channel, breaking its support line, which was tested from below today (1.6960).
Additionally, in the H4 chart, we can find a Head and Shoulders formation. It is true that it is not “perfect” ( we have two left “shoulders), but anyway we can conclude that the H&S has been completed and the price has already beaten the neck line.
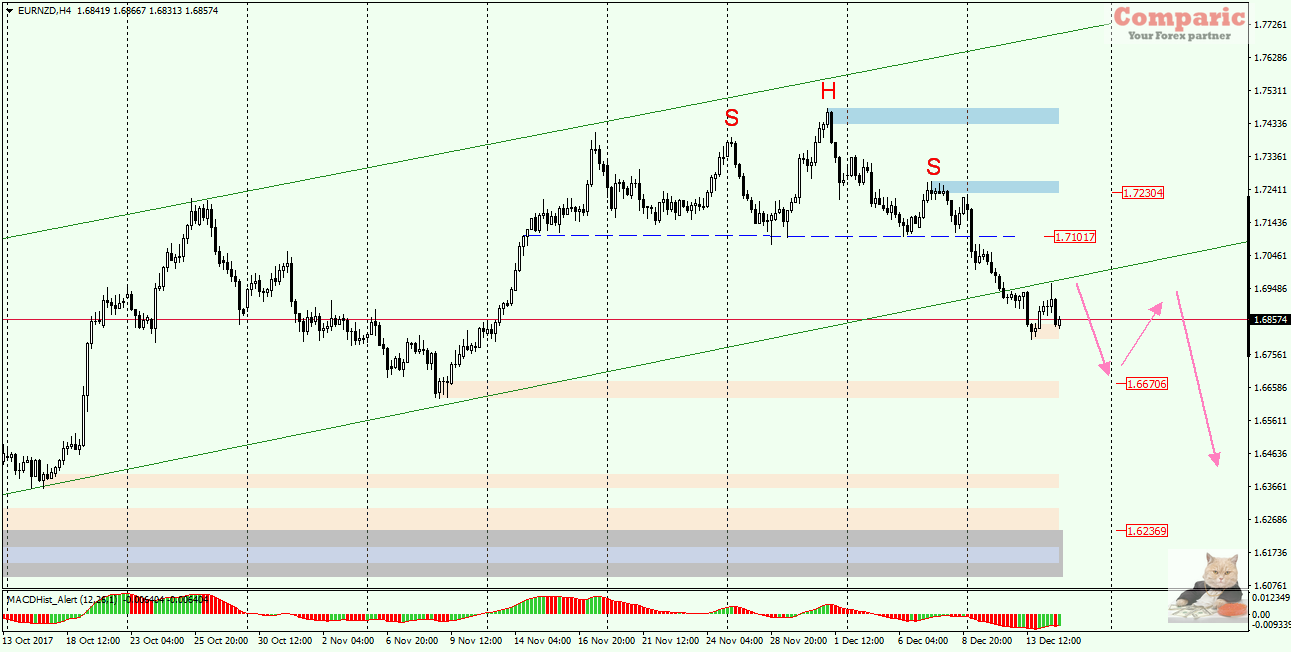
If the bearish scenario were to be realized, the range of decreases may reach the height of the H&S formation, i.e. around 380 pips.
Along the way, the pair will have to overcome the support level of 1.6670, where an upward correction is very likely.
Very interesting is also the zone 1.6236 – 1.6100 (gray color on the weekly chart ) – which already served 3 times as a support and 2 times worked as resistance. However, for the price to reach this zone, EURNZD would have to cover a distance of 630 pips.
In case the price will negate the H&S formation and returns to the growth channel probability of bearish scenario will be significantly reduced.