Today we get the final manufacturing purchasing managers’ indices (PMIs) from those countries that announce preliminary versions (France, Germany, EU and US), as well as the US version from the Institute of Supply Management (ISM), the original version of this indicator. For those countries that have already announced preliminary versions, the market forecast for the final version is always the same as the preliminary one.
The European day starts off with the Swiss manufacturing PMI. Usually CHF barely reacts unless the figure beats estimates by a considerable amount.The focus in the European morning then will be on the UK, where the manufacturing PMI is expected to decline notably. In fact, all three UK PMIs are expected to decline this week. Coming after last week’s surprise downward revision to 2Q GDP, this would confirm the image of a slowing economy – just as the Bank of England appears ready to start raising rates. That’s a big negative for UK assets and therefore negative for the pound.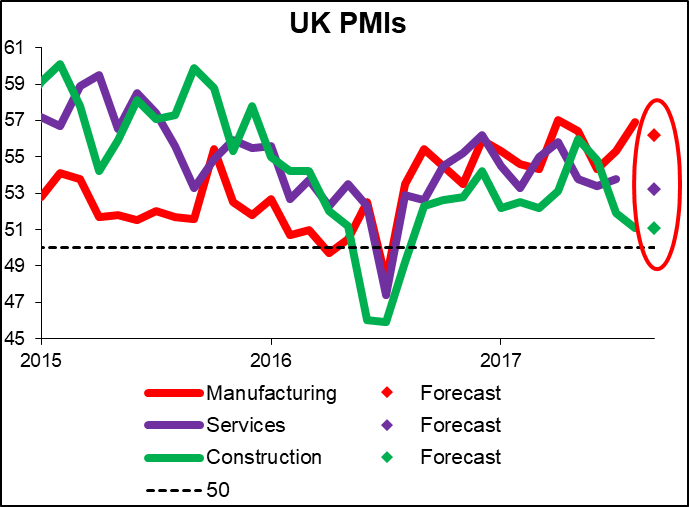
Canada’s manufacturing PMI is a bit unusual. There are no economists’ forecasts for the series, yet it does seem to be market-affecting – over the last year, there’s been a market reaction greater than ±0.1% half the time in the 30 minutes following the announcement and seven times in the hour afterwards. That shows quite a significant impact. Bloomberg also shows that a large number of people who watch Canadian indicators watch this one, too. For the US, the revised Markit manufacturing PMI isn’t as important as the ISM index that comes out a few moments later. The manufacturing PMI is expected to decline somewhat, but the prices paid index – a leading index of future inflation – is forecast to rise. My analysis suggests that the ISM index seems to have a stronger impact on EUR/USD over the first 30 minutes after the figure is released, but the prices paid index may have a stronger impact over an hour. This would make sense if most investors were focused on the headline number and it takes them a while to get around to reading some of the details about the figure. Thus the dollar could strengthen eventually even if the ISM index does fall as expected.
The ISM figure is likely to take on more importance than usual this week, because of the distortions to the nonfarm payrolls caused by Hurricanes Harvey and Irma. Given the difficulty evaluating their impact on the employment data, investors may choose to rely more on the ISM figures this month when evaluating the health of the US economy. 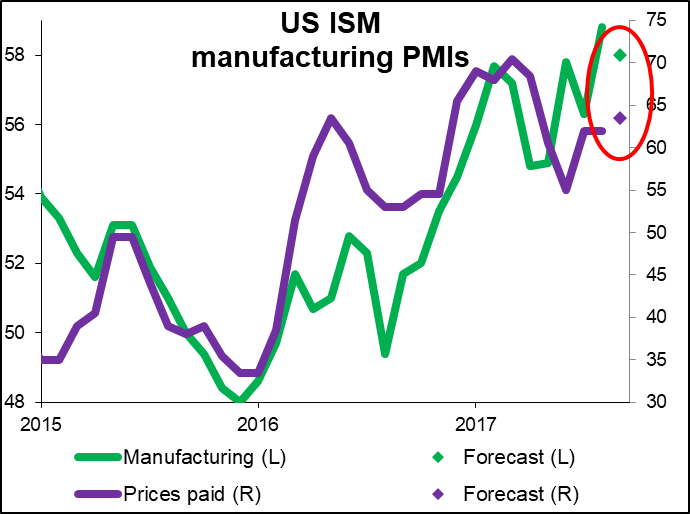
US construction spending comes out at the same time as the ISM manufacturing index. It’s not as important to the market as the other two are, however.
EUR/JPY in the cloud
Let’s look at the four-hour chart. Tenkan-sen line is above Kijun-sen, the lines are horizontal . Confirmative line Chikou Span has crossed the price chart from below, current cloud is descending. The instrument is trading around upper border of the cloud. The closest support level is Tenkan-sen line (132.68). The closest resistance level is the lower border of the cloud (133.05).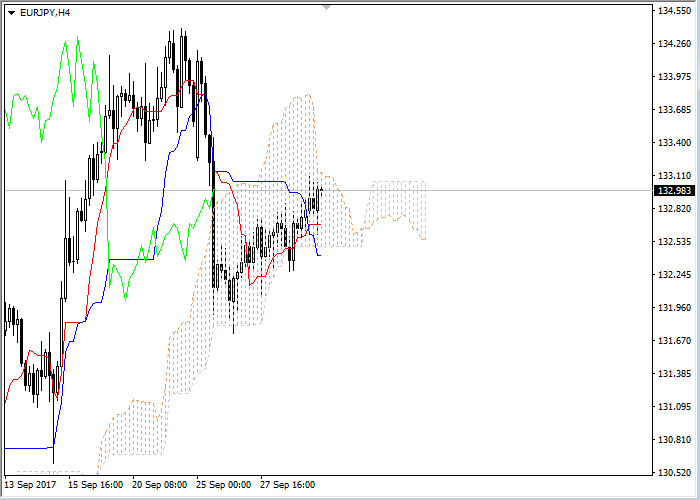
On the daily chart Tenkan-sen line is above Kijun-sen, the blue line is directed upwards, while the red one remains horizontal. Confirmative line Chikou Span is above the price chart, current cloud is ascending. The instrument is trading between Tenkan-sen and Kijun-sen lines. The closest support level is Tenkan-sen line (132.50). The closest resistance level is Tenkan-sen line (133.04).
![]()
![]() STO is a broker regulated by FCA and CySEC. It offers more than 300 financial instruments such as Forex, Indices, Oil, Stocks, Commodities and Bonds. STO clients have possibility to trade thanks to reliable MT4 and AFX FAST platforms. Check STO offer!
STO is a broker regulated by FCA and CySEC. It offers more than 300 financial instruments such as Forex, Indices, Oil, Stocks, Commodities and Bonds. STO clients have possibility to trade thanks to reliable MT4 and AFX FAST platforms. Check STO offer!


