NZDUSD since July 2014 stays in bearish trend. Looking a little closer we should take a look at move lasting since September 2015 – side trend with 0.6880 key resistance. There is a lot of space till that place and today I would like to think about even smaller time frame, lasting from January 20th.
THIS ANALYSIS WAS CREATED IN COOPERATION WITH XM BROKER. OPEN FREE XM ACCOUNT AND GET FREE $30 FOR YOUR TRADING.
On H4 chart we can clearly see this bullish trend. After very dynamic rebound there is time of correction. It is probably simple correction with equal bearish lines. If it is true current decreases should stop at key support at 0.6550-60. As we can see in this area there is also few times tested bullish trend line.
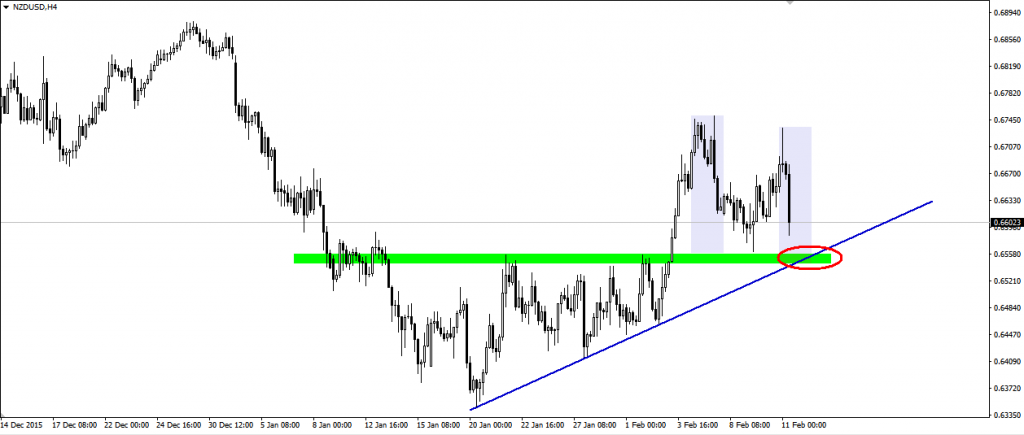
It seems like we should be patient and wait for end of correction and bullish signal in this area. If support and trend line will fall it will be clear signal of going back to wider bearish trend.


