The Emini is selling off from its test of the early February high. However, last week’s rally was so strong that it is more likely that a the selloff will be limited to a couple of days, rather than a reversal of the rally. The cash index will probably get above its February 1 high this week, which means that this selloff will probably be bought tomorrow or Thursday.
Monday is the last day of the month and traders are trying to influence the appearance of the monthly candlestick bar. With the Emini currently at the high of the month, it might simply stay in this area for a few days and then have a big move up or down on Friday or Monday.
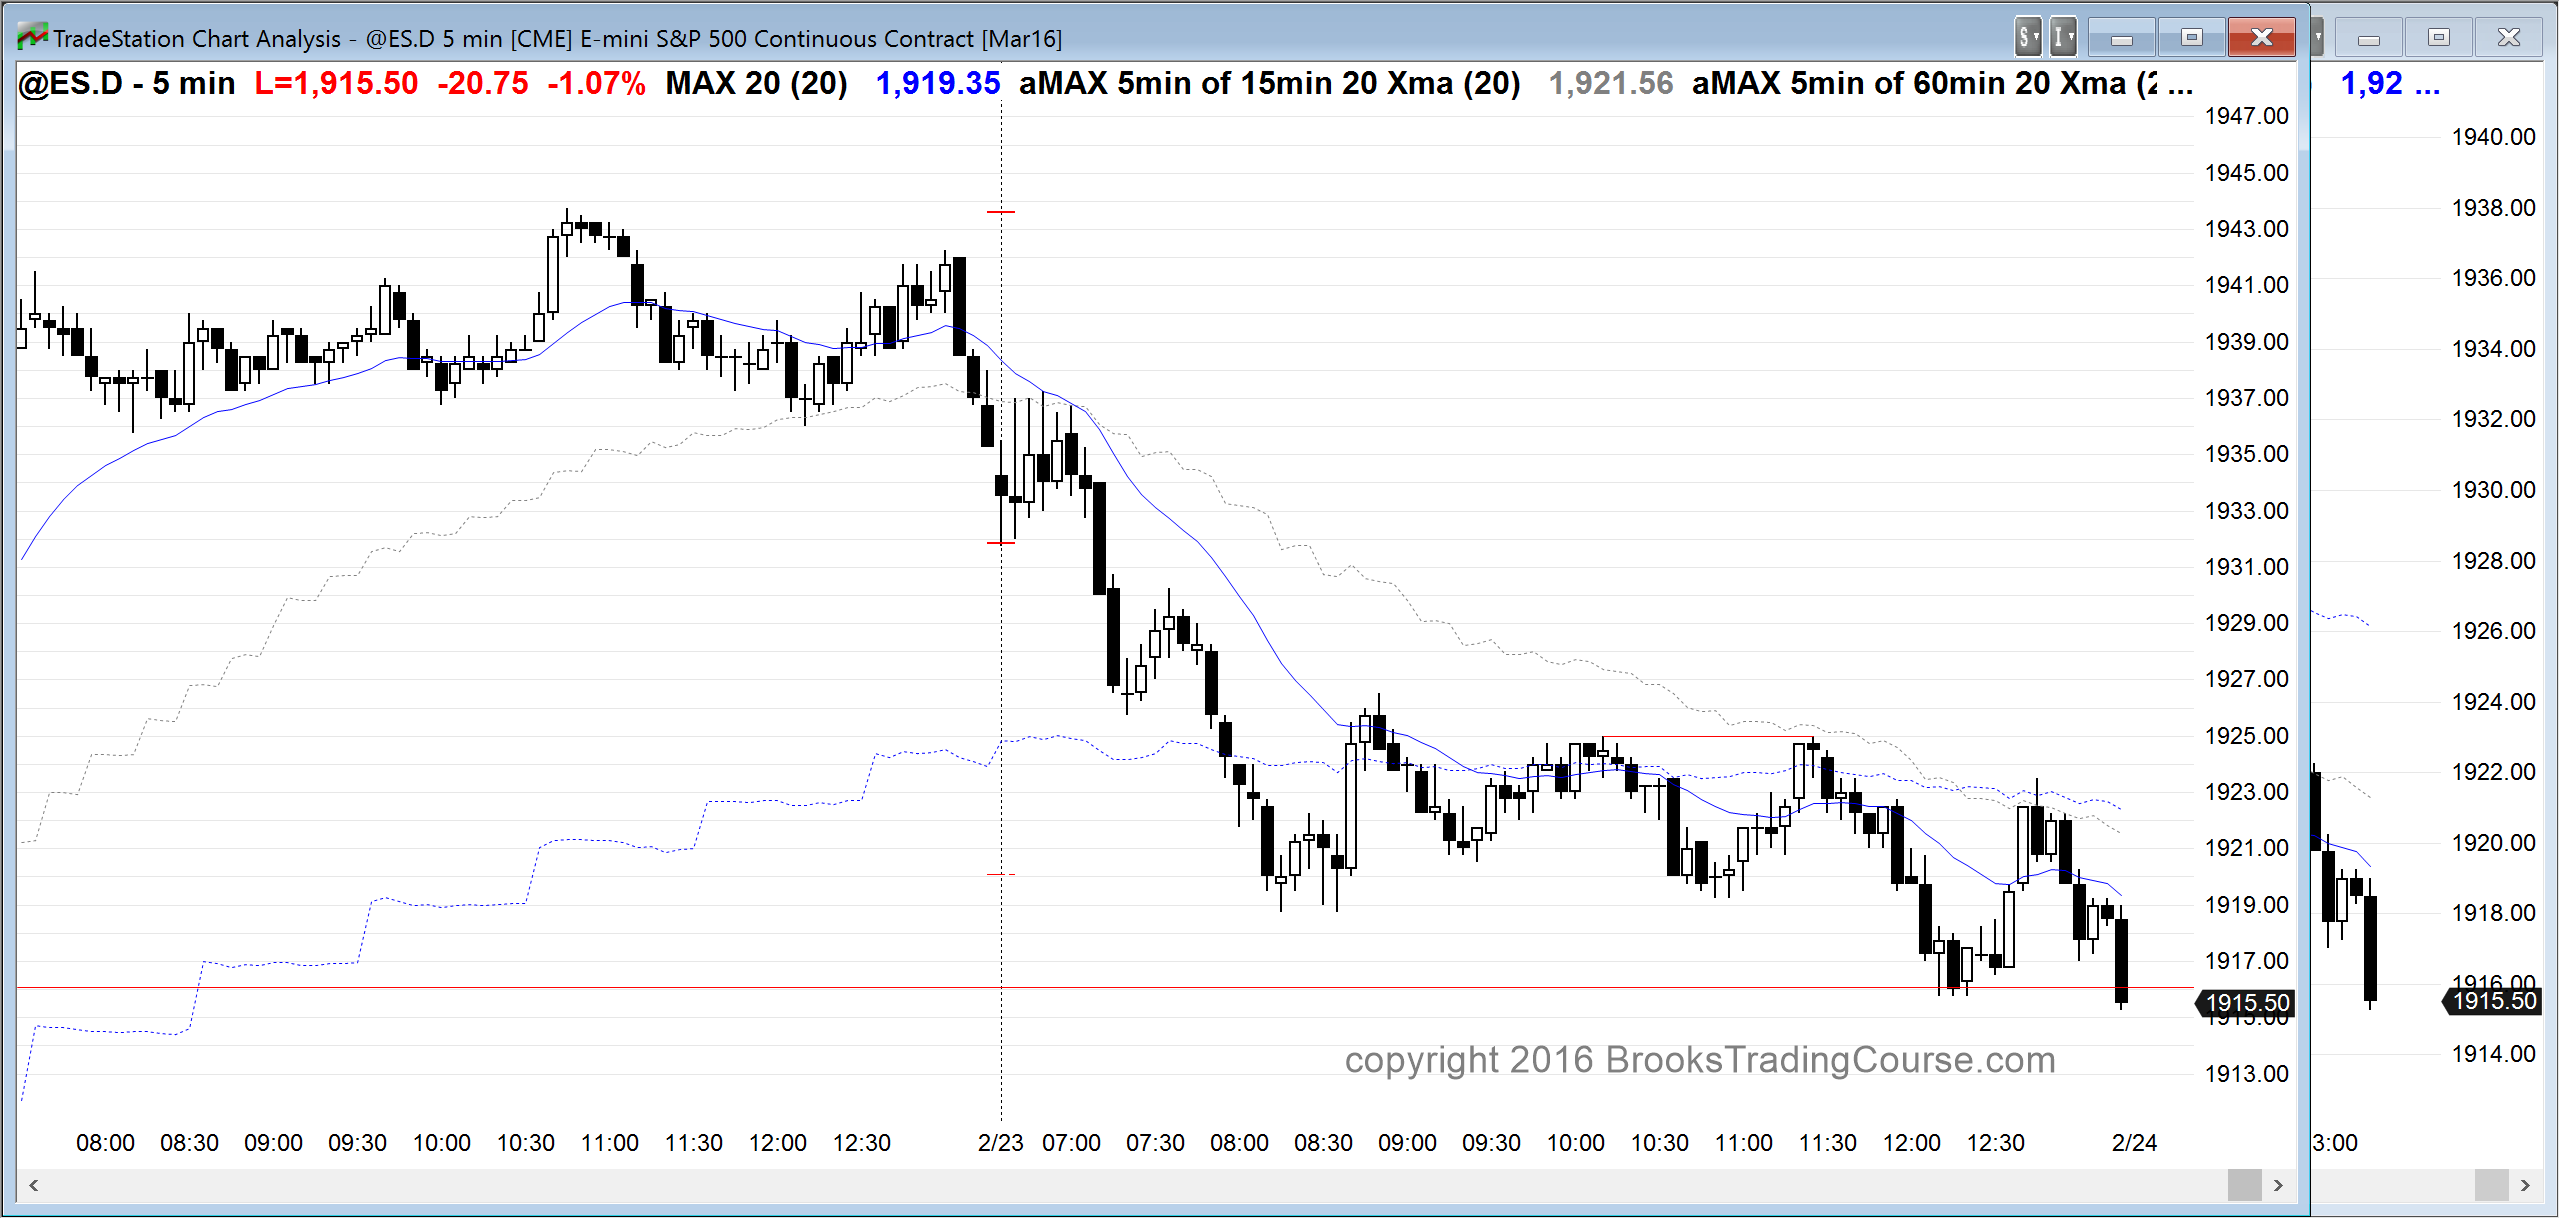
In any case, as bearish as today was on the 5 minute chart, it so far is just a pullback from yesterday’s test of the top of the 2 month trading range. The bears need several more strong bear trend bars before traders believe that the Emini is ready to break below February’s low. More likely, the best the bears will get is a sideways market for a few days, hoping to create some selling pressure (bear bodies closing near their lows). After that, they would have a better chance of a reversal down.
See the weekly update for a discussion of the price action on the weekly candlestick chart and for what to expect going into next week.


