Monthly S&P500 Emini futures candlestick chart: Sell signal bar
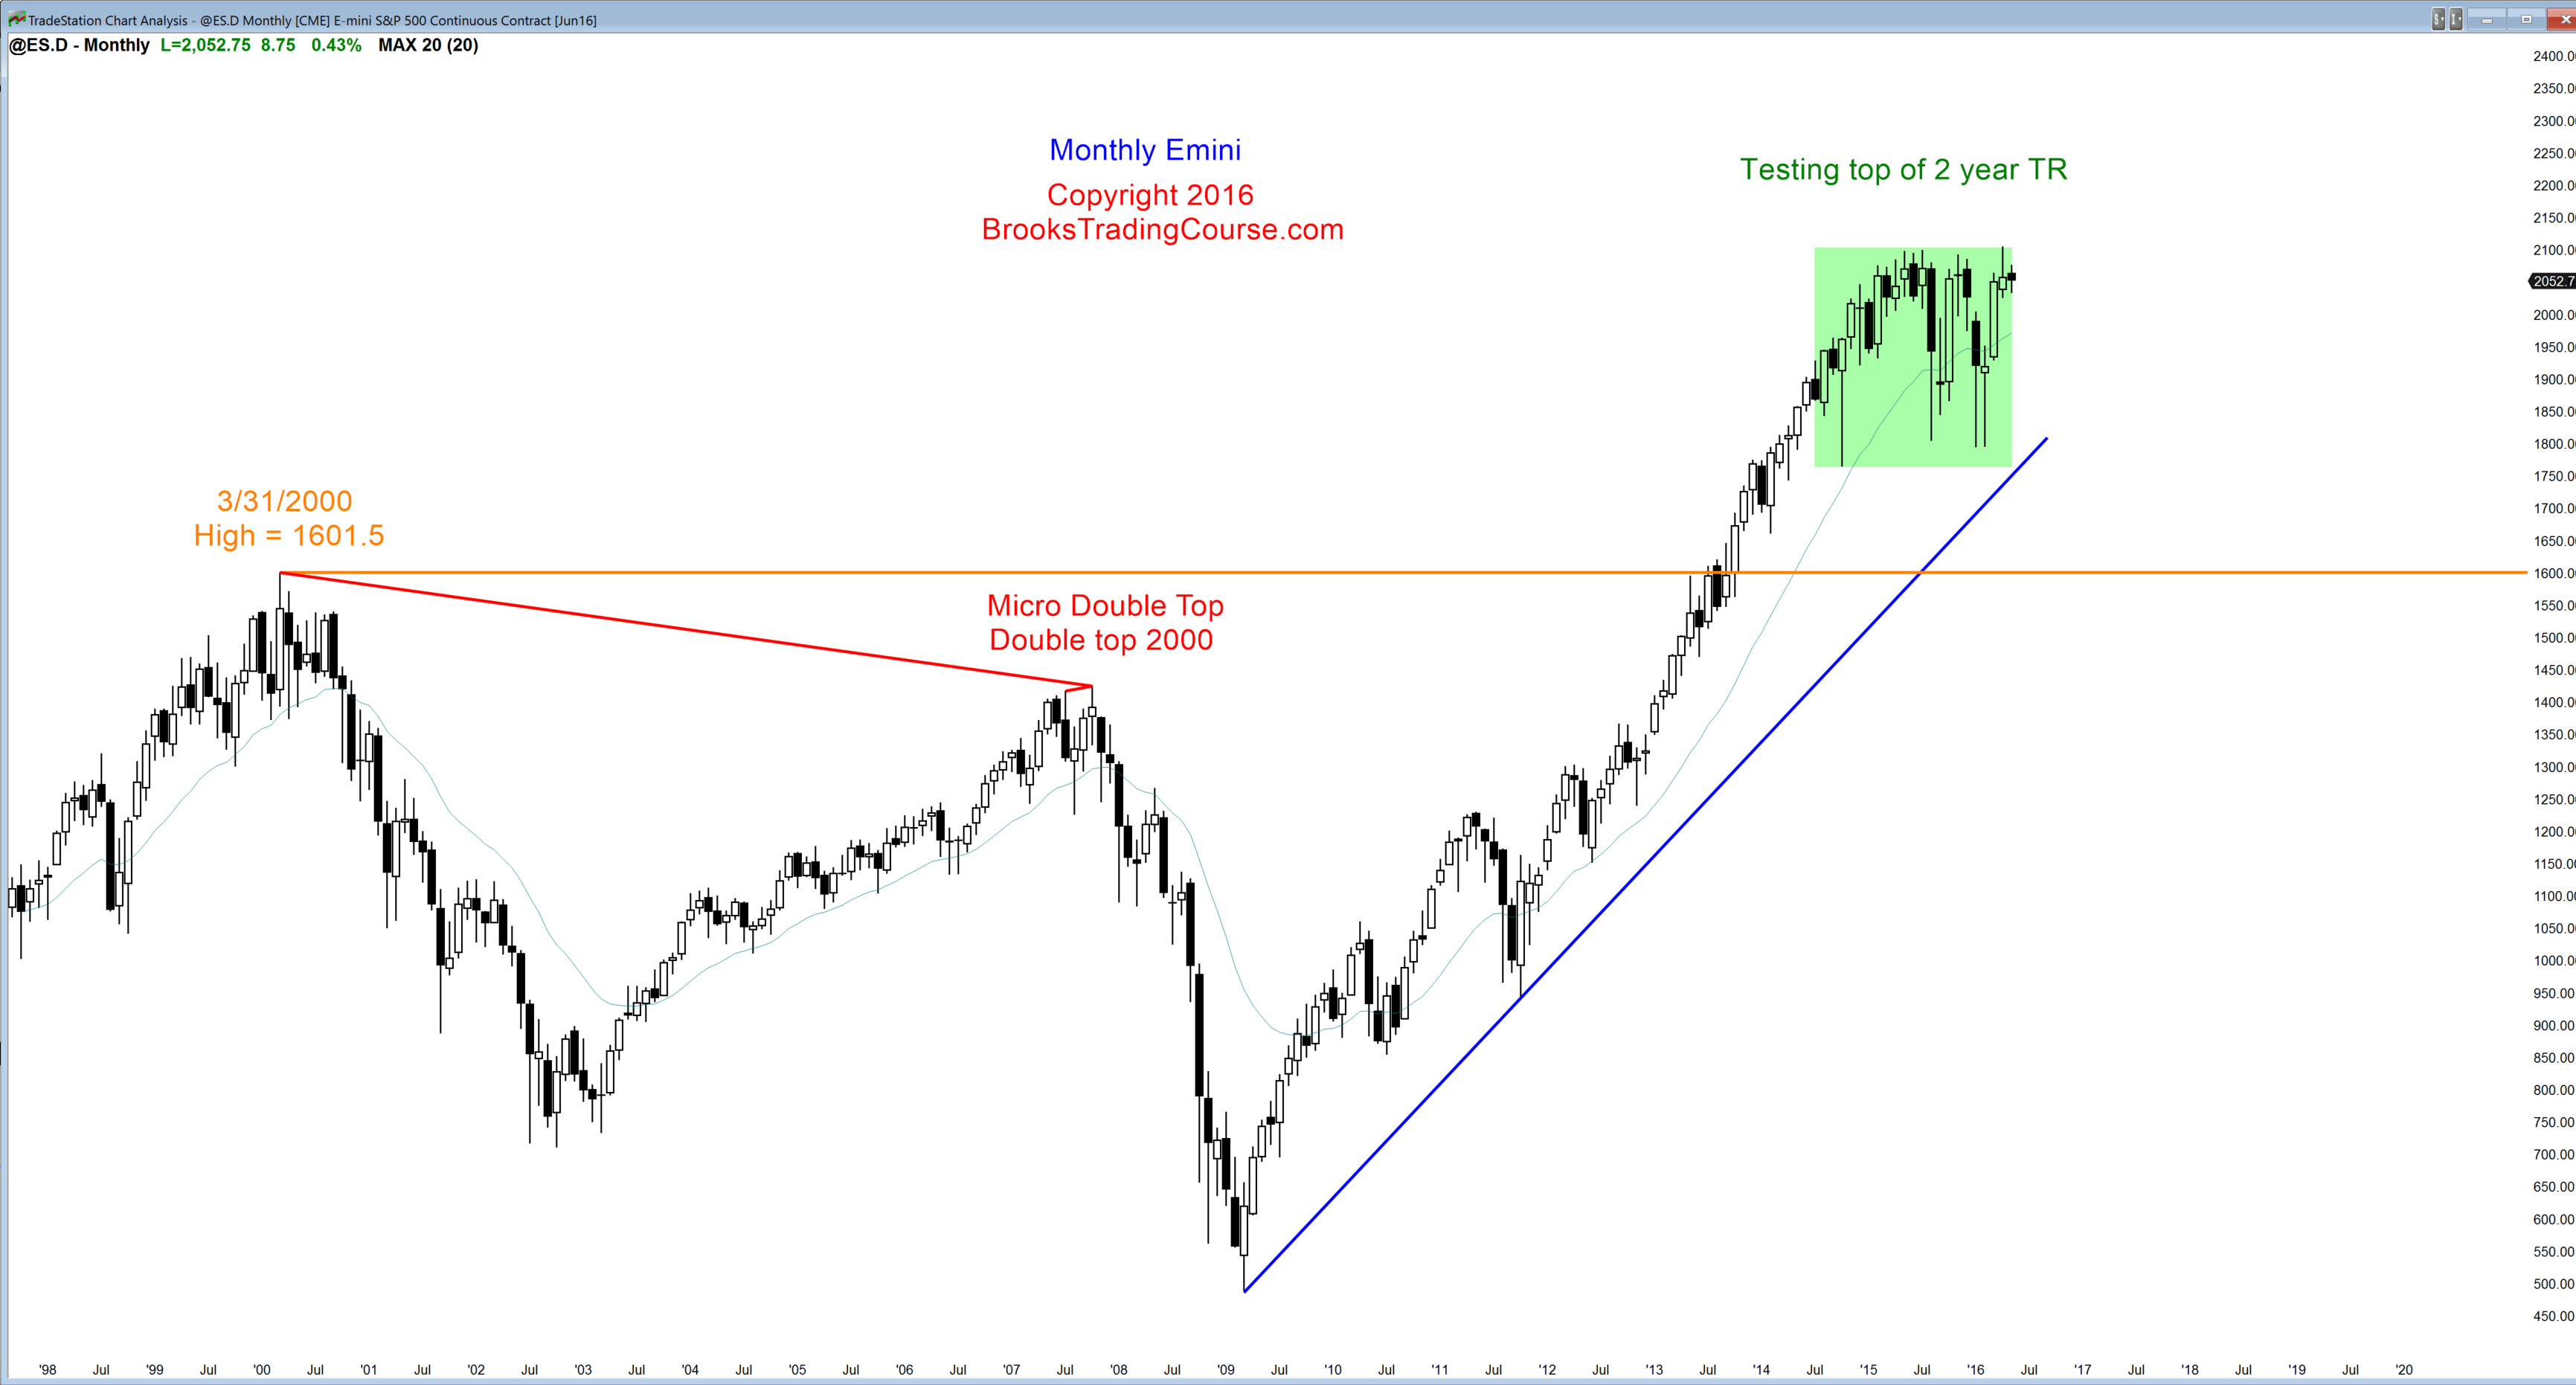
If the monthly S&P500 Emini futures candlestick chart trades 1 tick below the April low of 2026, it will trigger the sell. Since the sell signal bar has a bull body and the rally up from February was so strong, the odds are that there are more buyers below the April low than sellers. The bear breakout will probably form a pullback instead of a swing down.
The close of last year is only 1 tick above the April low and is another magnet. The bears want the stock market to be down on the year and therefore want it to fall far below the December 31 close of 2026.25. That area is support and therefore a magnet. When the market is in a trading range, and the monthly chart has been in a trading range for 2 years, it usually goes beyond support and resistance before reversing. Just look at April, which went above the top of the range and reversed down. Similarly, many traders will not look to buy a selloff unless the selloff falls below support and reverses up. This means that if the Emini rallies for a few days next week, it might come down to the 2026 area before testing the April high.
Weekly S&P500 Emini futures candlestick chart: Bull flag
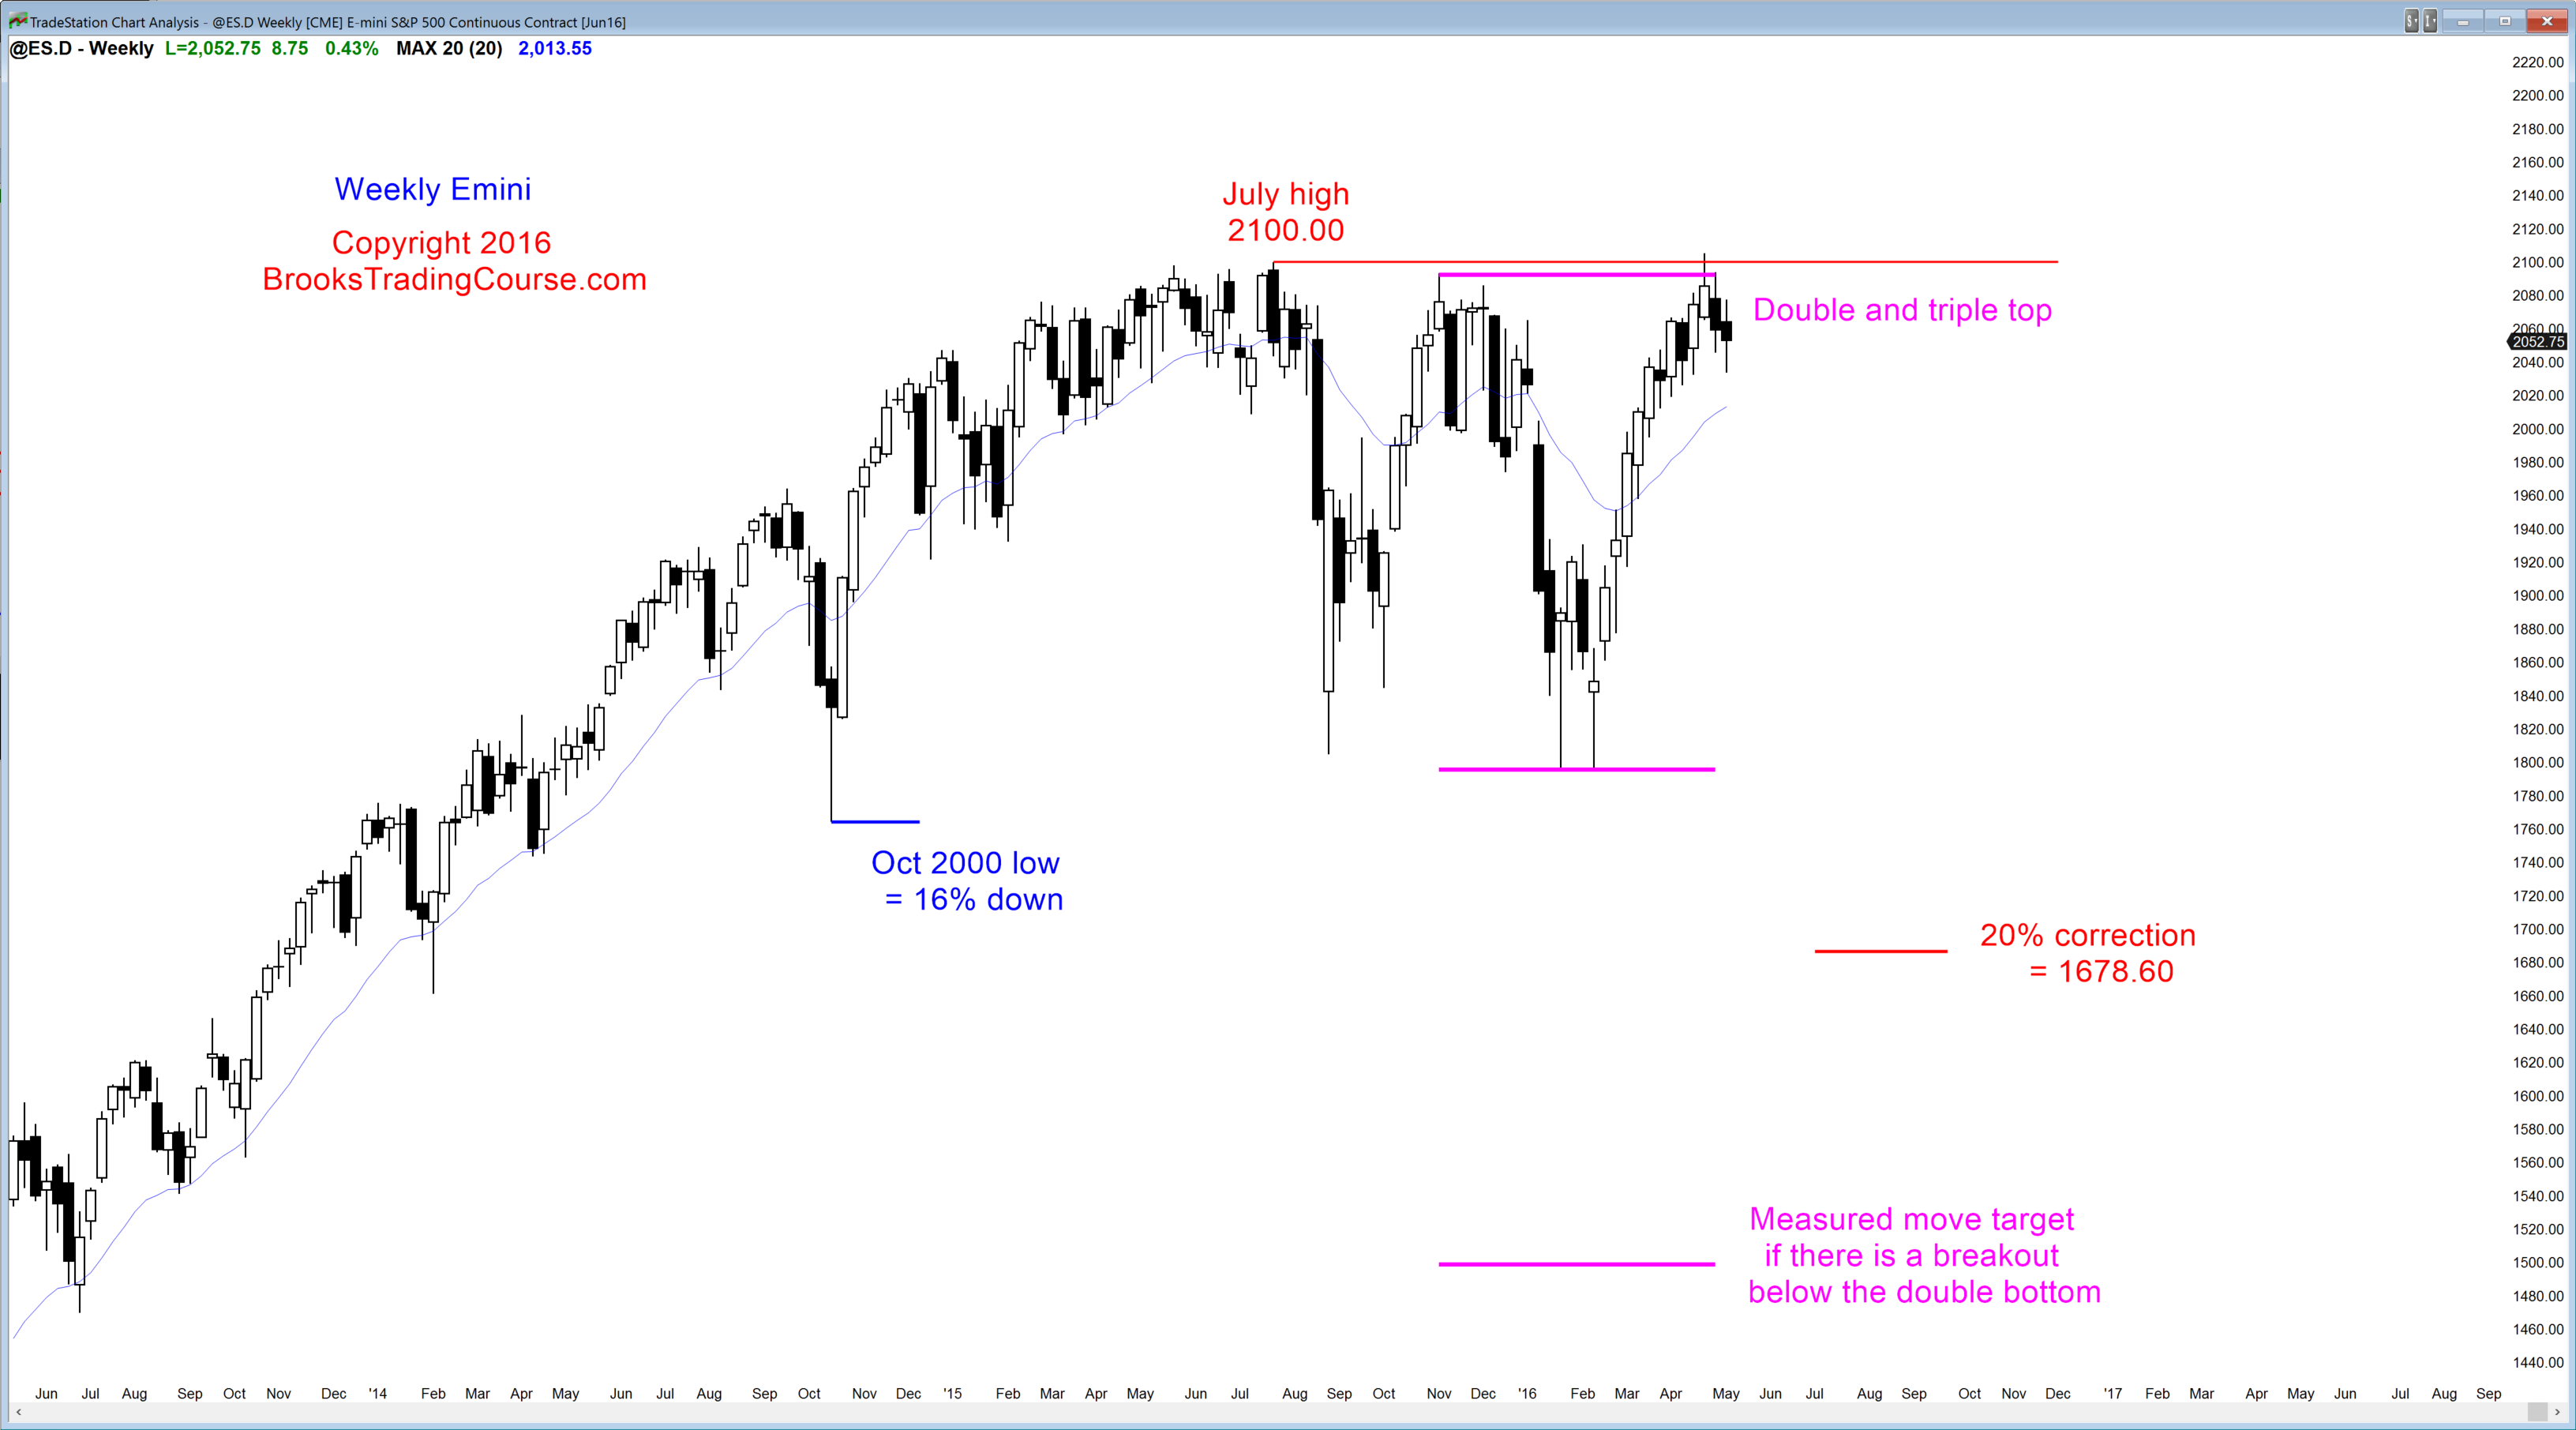
The weekly S&P500 Emini futures candlestick chart had an eleven week bull micro channel. This has only happened 2 other times in the past 10 years, and both prior times were followed by a trading range. That is likely this time as well.
An 11 bar micro channel is unsustainable and therefore climactic. Three weeks ago, I wrote that there was a 90% chance of a pullback within the next 2 weeks. When there is a bear break below a bull micro channel, it is usually bought within 3 weeks. Although it is a buy climax, it is also a sign of very eager bulls. They usually come back within 3 weeks. This means that this pullback will probably end by the end of next week.
Because the pullback has fallen relatively far, there is a Big Up, Big Down pattern on the weekly and daily charts. It is a sign that the bears are fairly strong, and they will be willing to sell the first rally. With the bulls hesitant to buy without a test of 2026, they will probably scalp out of a reversal up. With both bulls and bears looking to sell a rally, the odd are that the Emini will go sideways for at least a few more weeks.
Daily S&P500 Emini futures candlestick chart: Learn how to trade a wedge bull flag candlestick pattern
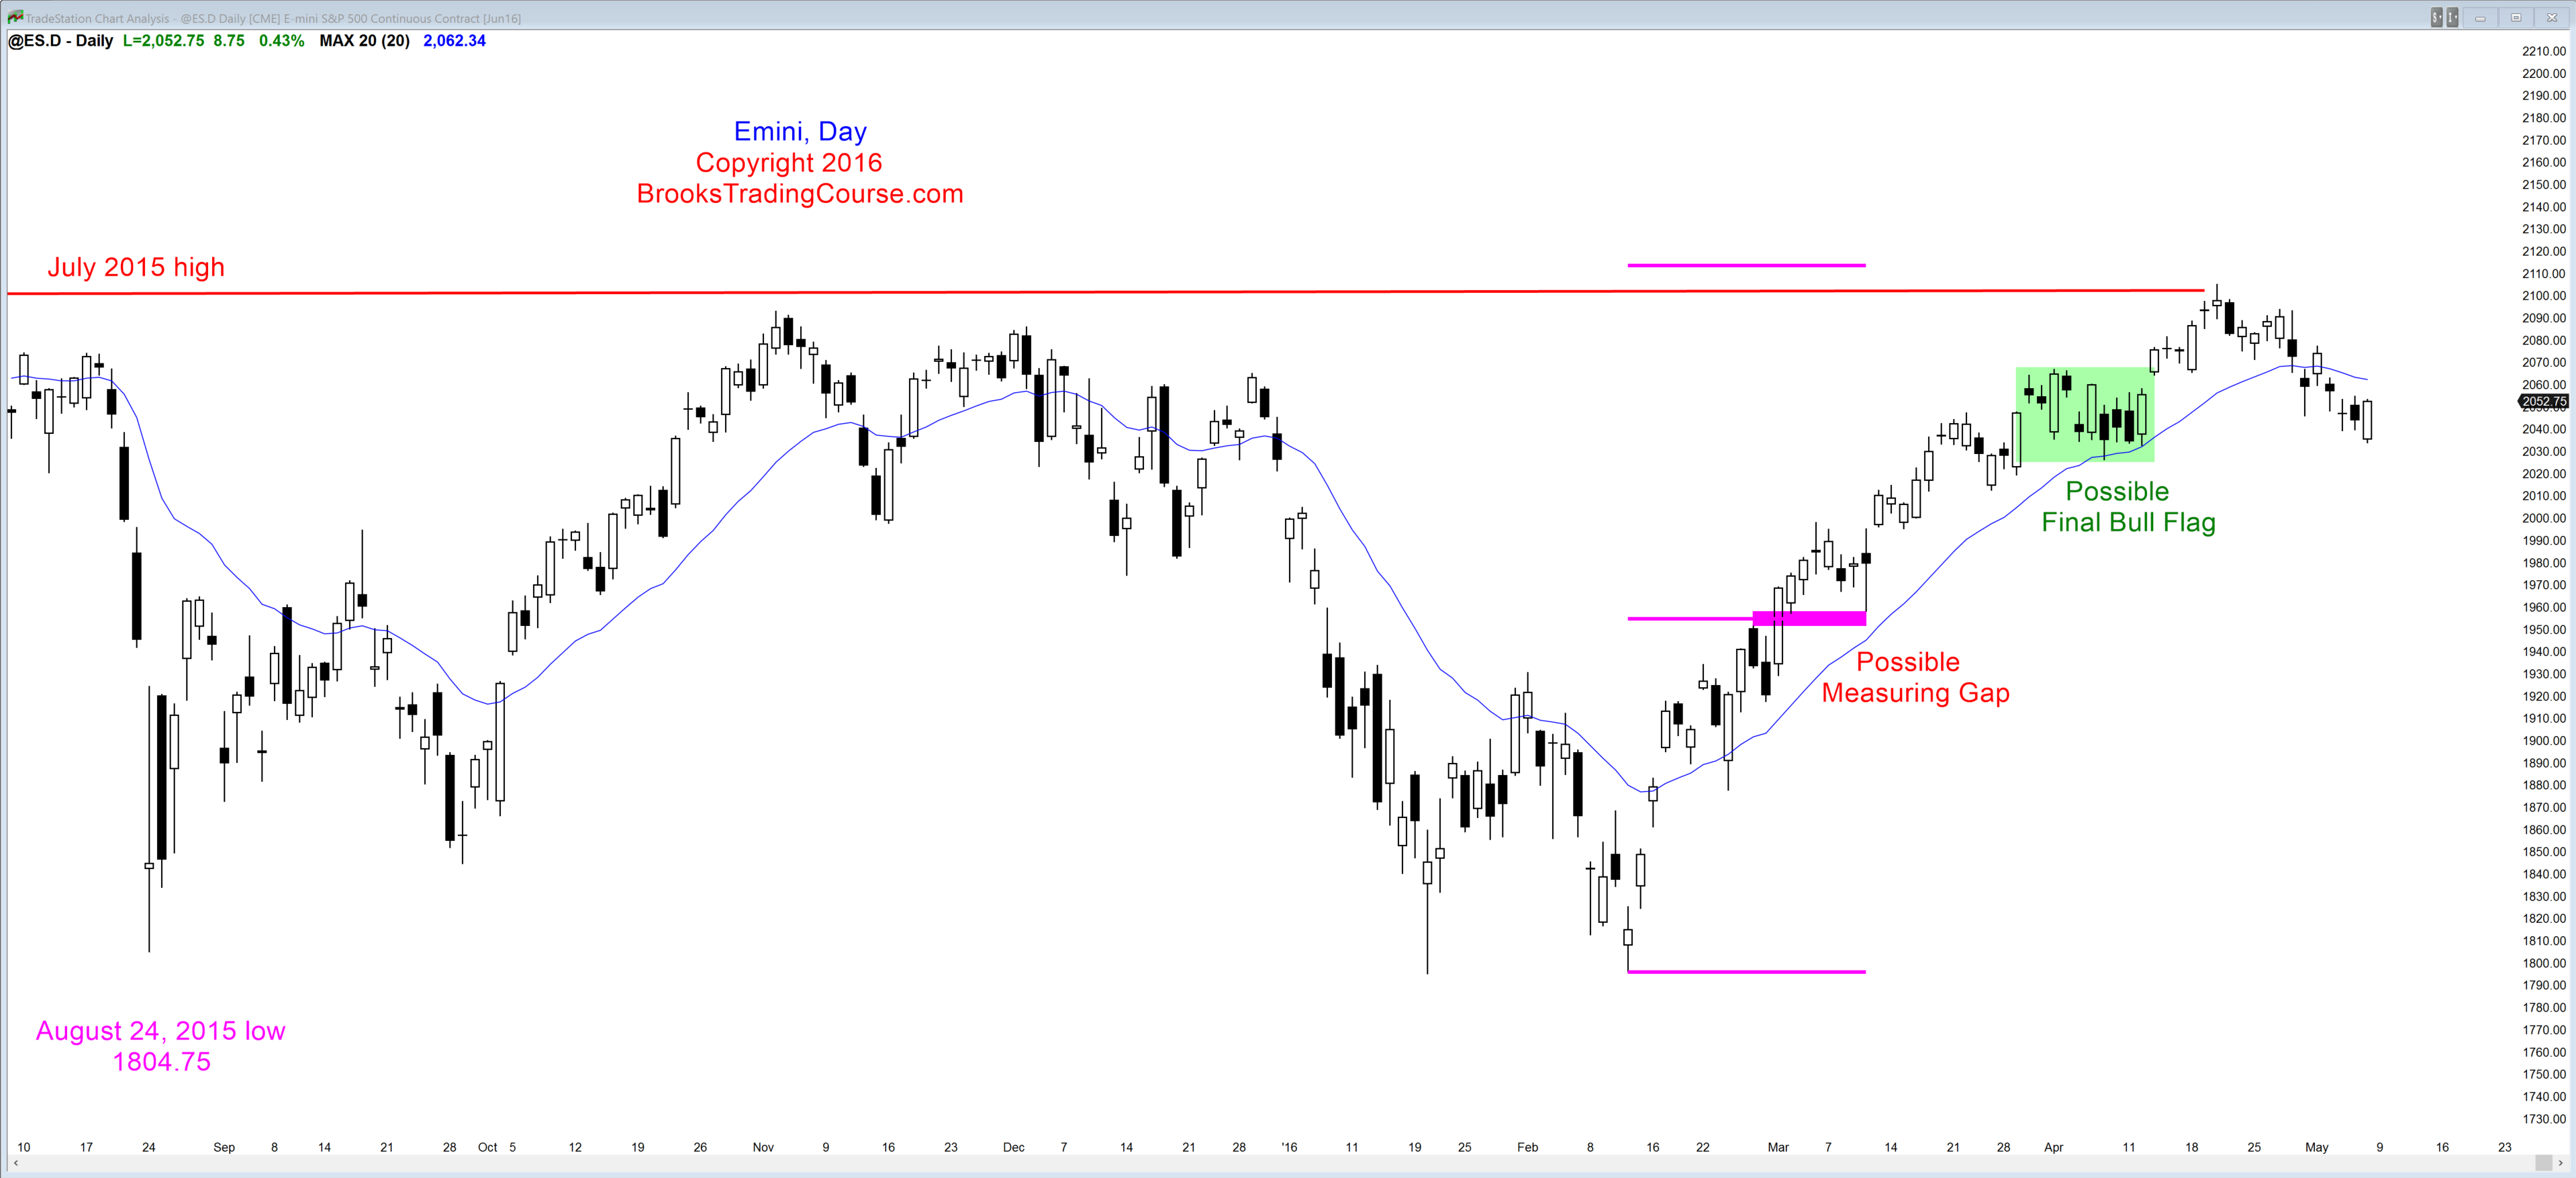
The daily S&P500 Emini futures candlestick chart has a micro wedge bull flag, which is a normal size wedge bull flag on a smaller time frame, like the 60 minute chart. A small pattern usually leads to a minor reversal instead of bull trend resumption. This means that the daily chart will probably be in a trading range for at least a couple of more weeks.
The odds are that the Emini will test the bottom of its April Final Bull Flag before it tests the April high. That bottom is the April 7 low of 2026. So that price is the close of last year, the bottom of last month’s sell signal on the monthly chart, and the bottom of the Final Bull Flag on the daily chart.


