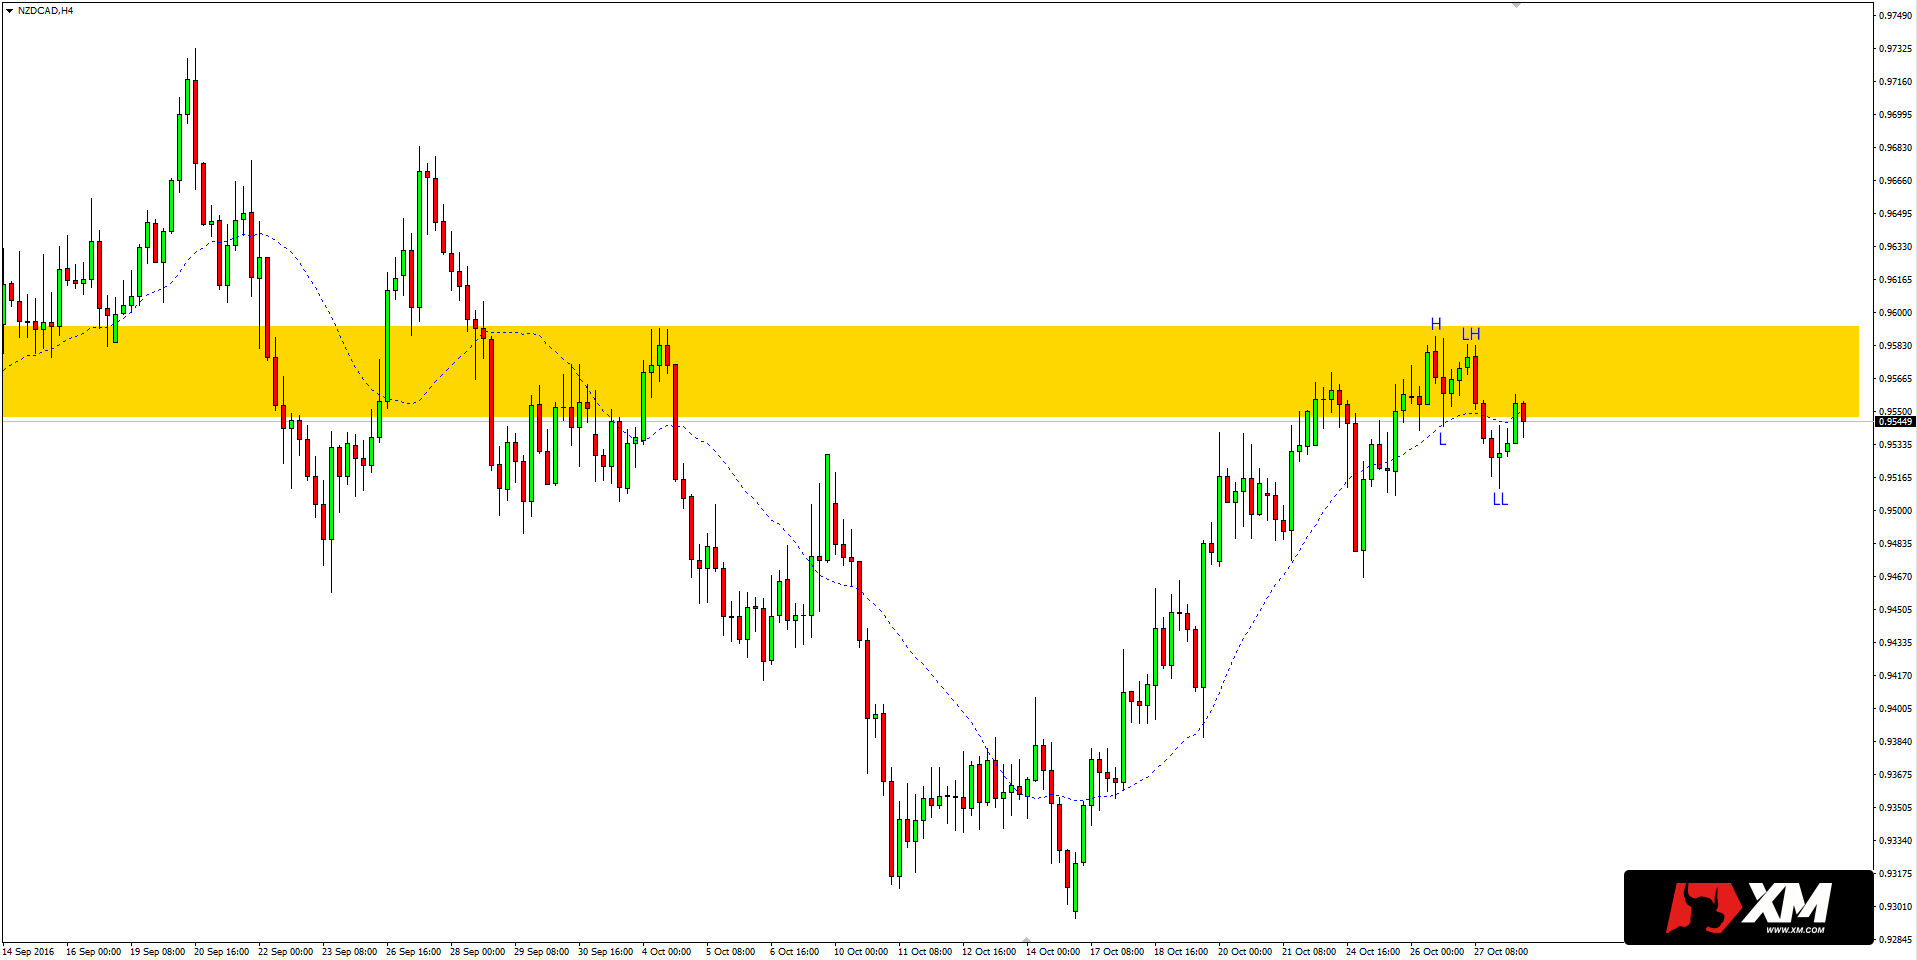
On the H4 chart we can see lower high – lower low sequence. Additionally price is under 20-period SMA again what indicates weakening of bullish movement.
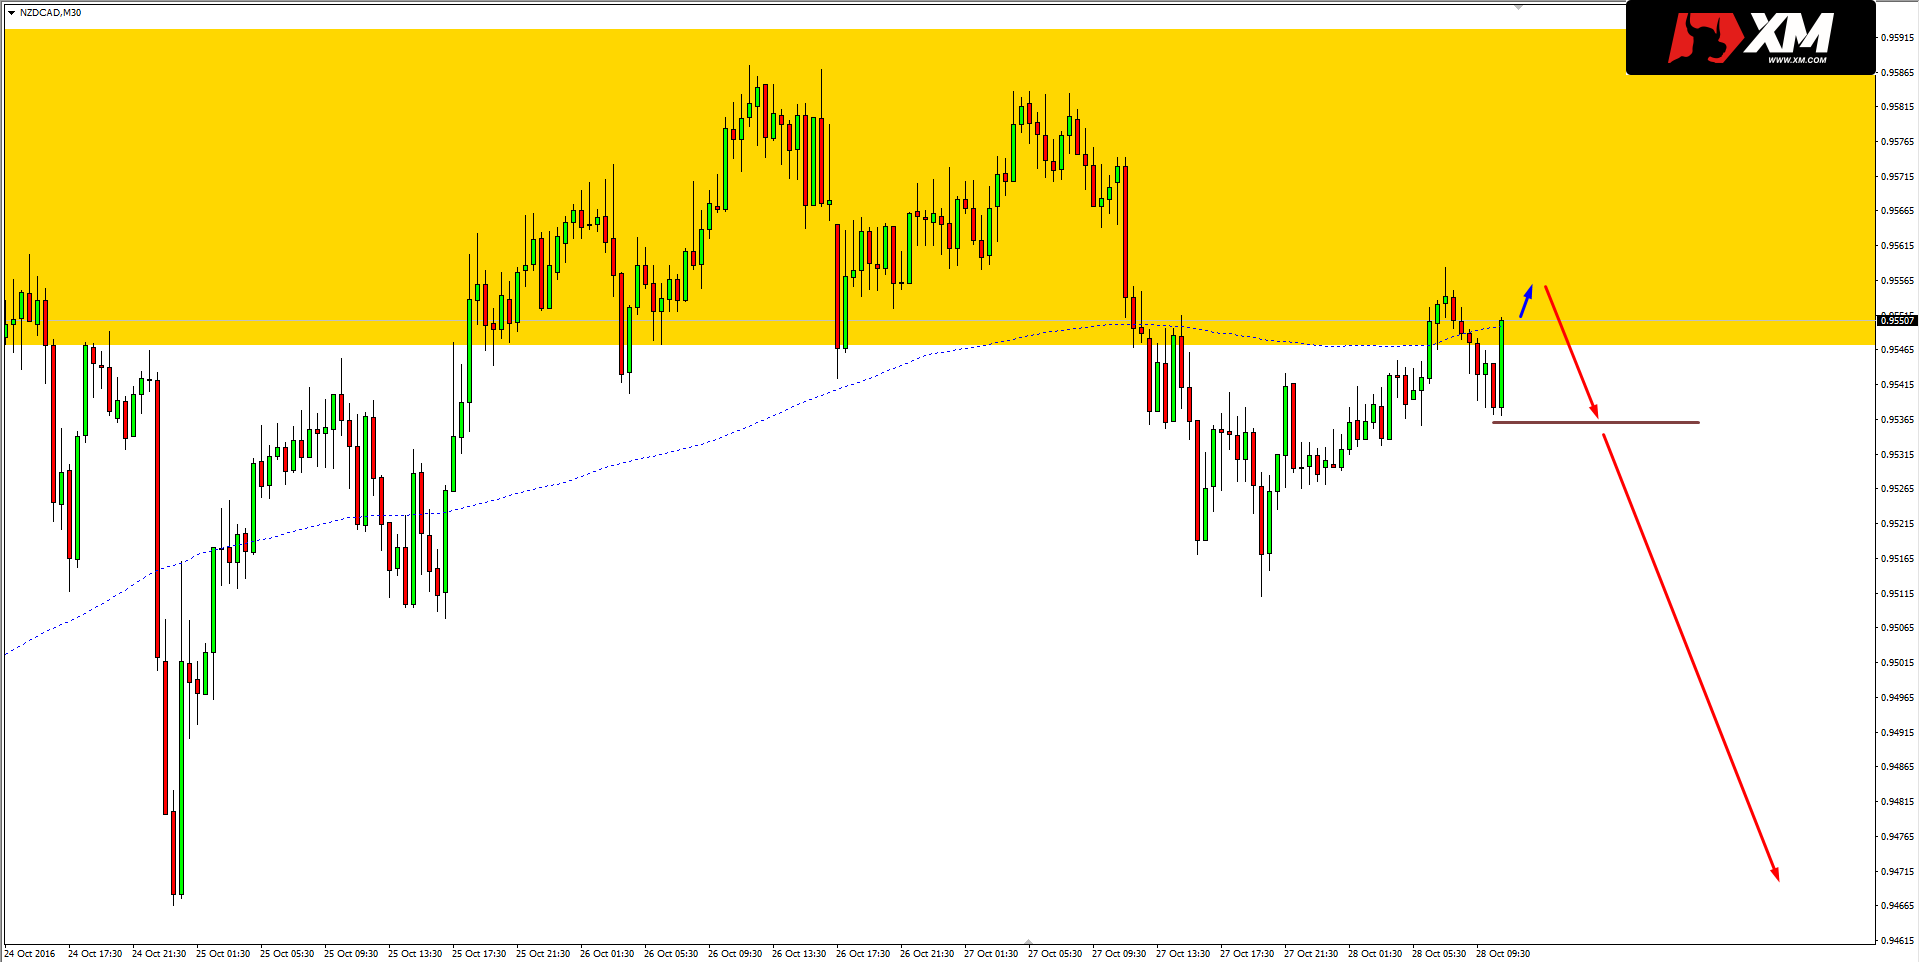
On the M30 chart there is a correction of last decreases, the end of that should be an opportunity to open short position. Breaking higher highs and higher lows sequence can be a signal to open position. The best scenario would be if that will happen below 20-period SMA from H4 chart.
Try out XM account and get free $30 bonus without any deposit


