 “Search, Analyse, Trade” is a series of Price Action and Elliott Waves analyses. Its detailed step-by-step description can be found over here. I invite you to today’s review of selected currency pairs and potential trading opportunities. The analyses are based on the Dukascopy sentiment that you can get here.
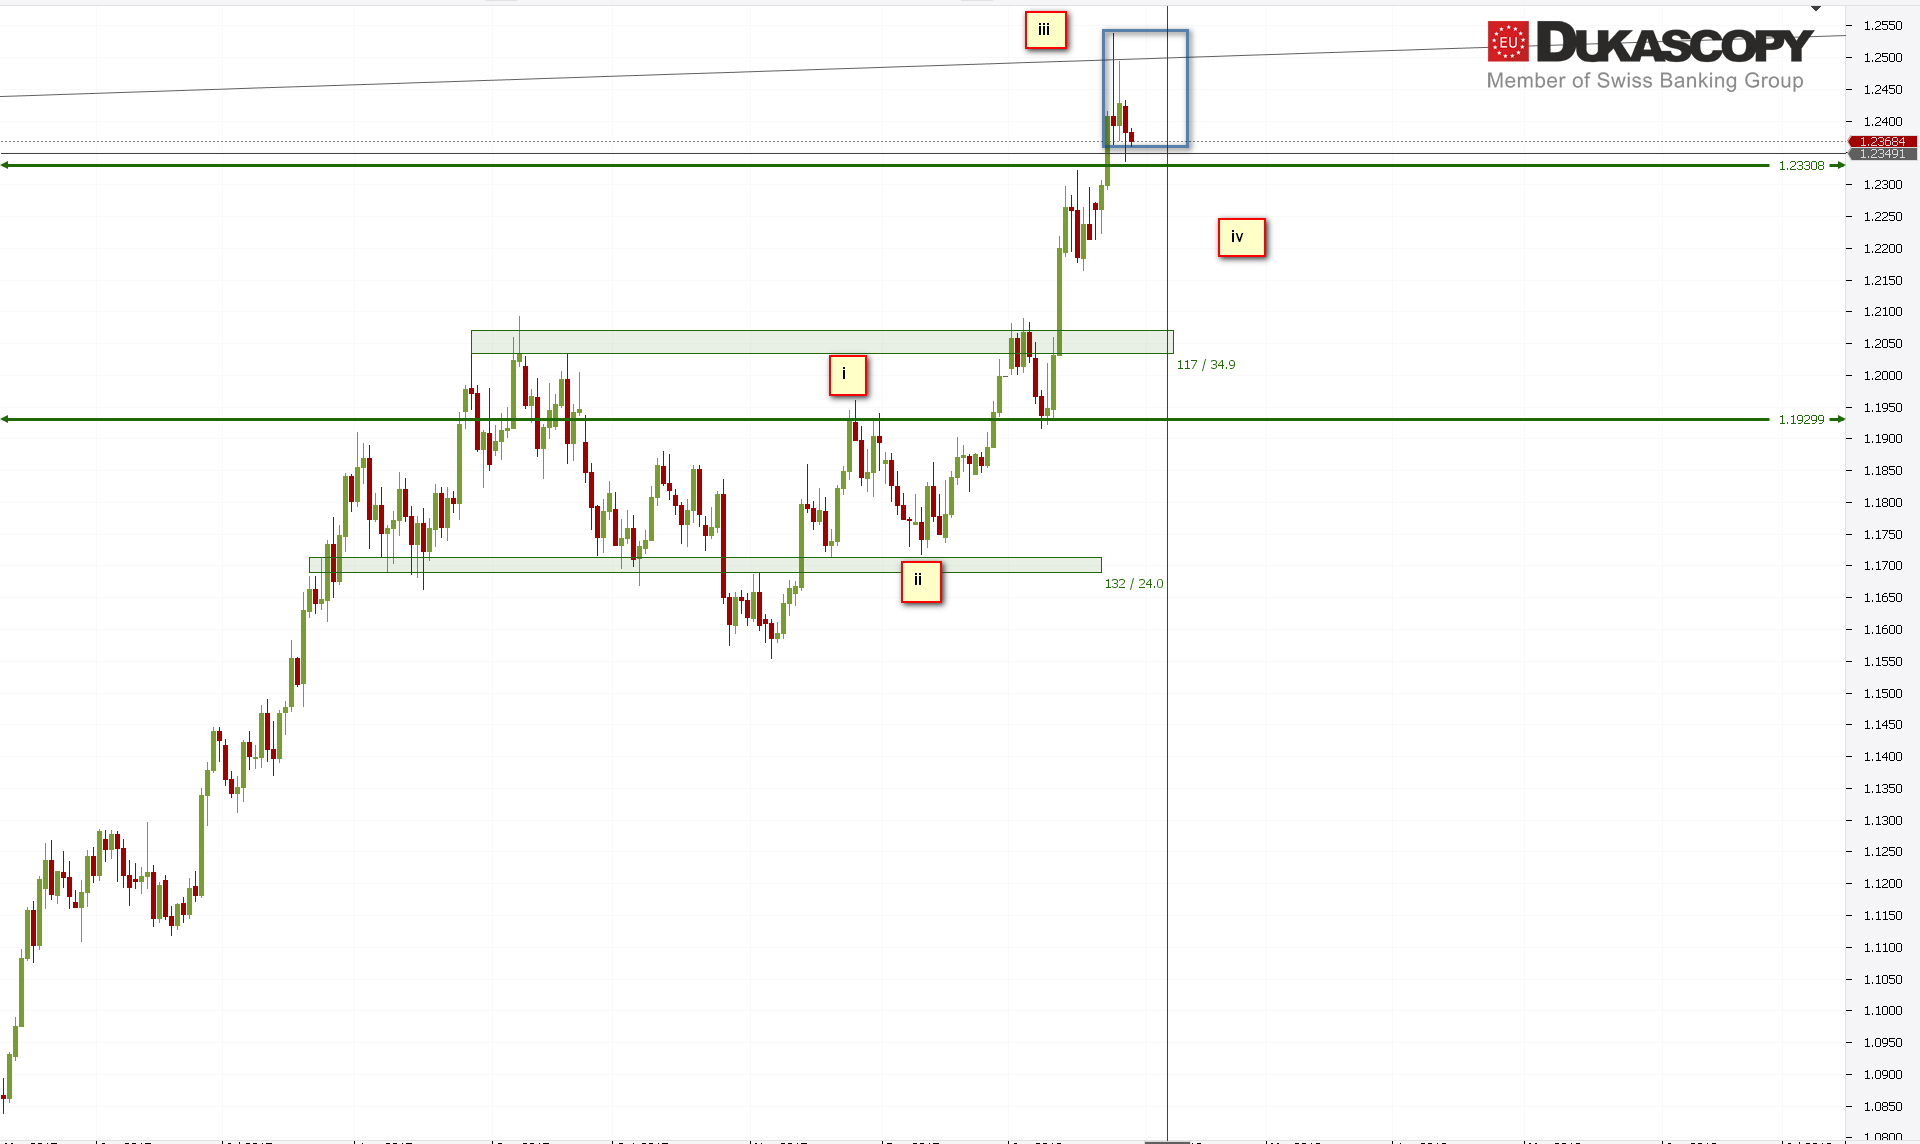
EUR/USD after an unsuccessful attack on the resistance zone resulting in a bearish Pin Bar, tries to break down from the Inside Bar, which formed just above the support. From the wave point of view, we should still be in the third wave. The current bearish movement may be the beginning of the fourth wave, after which we should see another attempt to attack the resistance. Such a move would take place within the fifth wave of the last wave of growth.
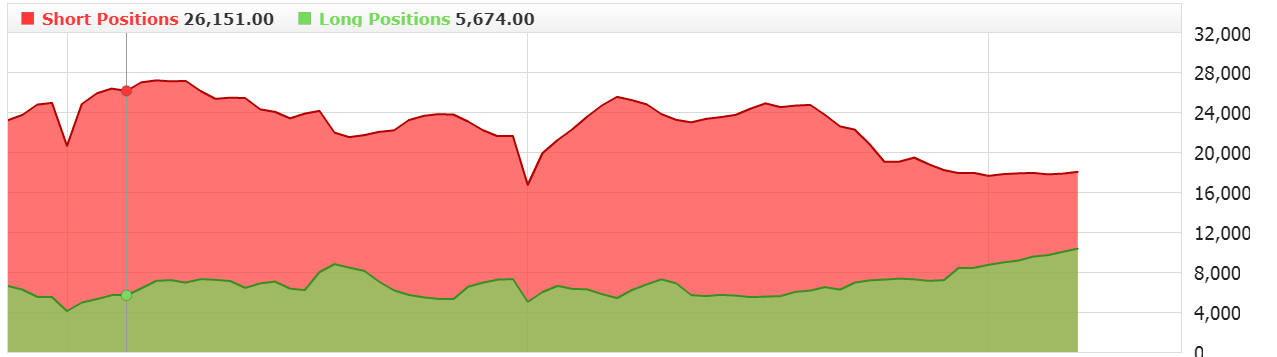
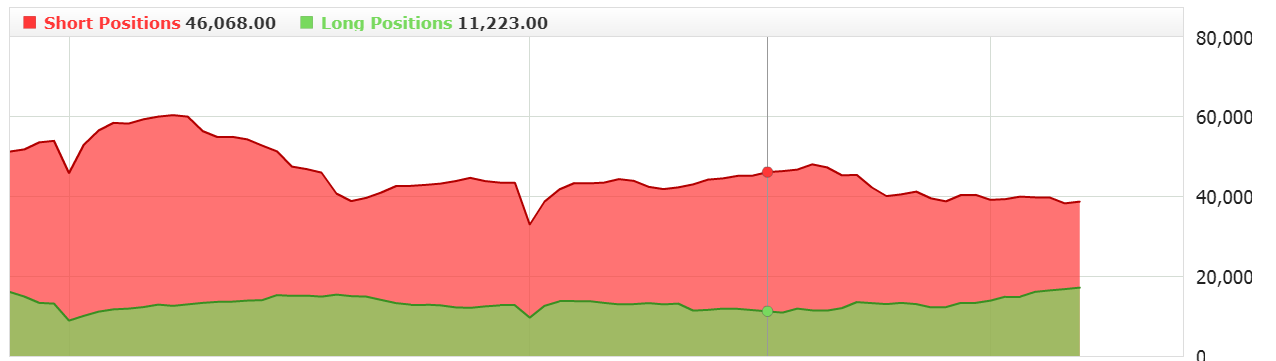 The sentiment, for now, points on longs. Recently, long positions have been increasing with a slow reduction of short ones.
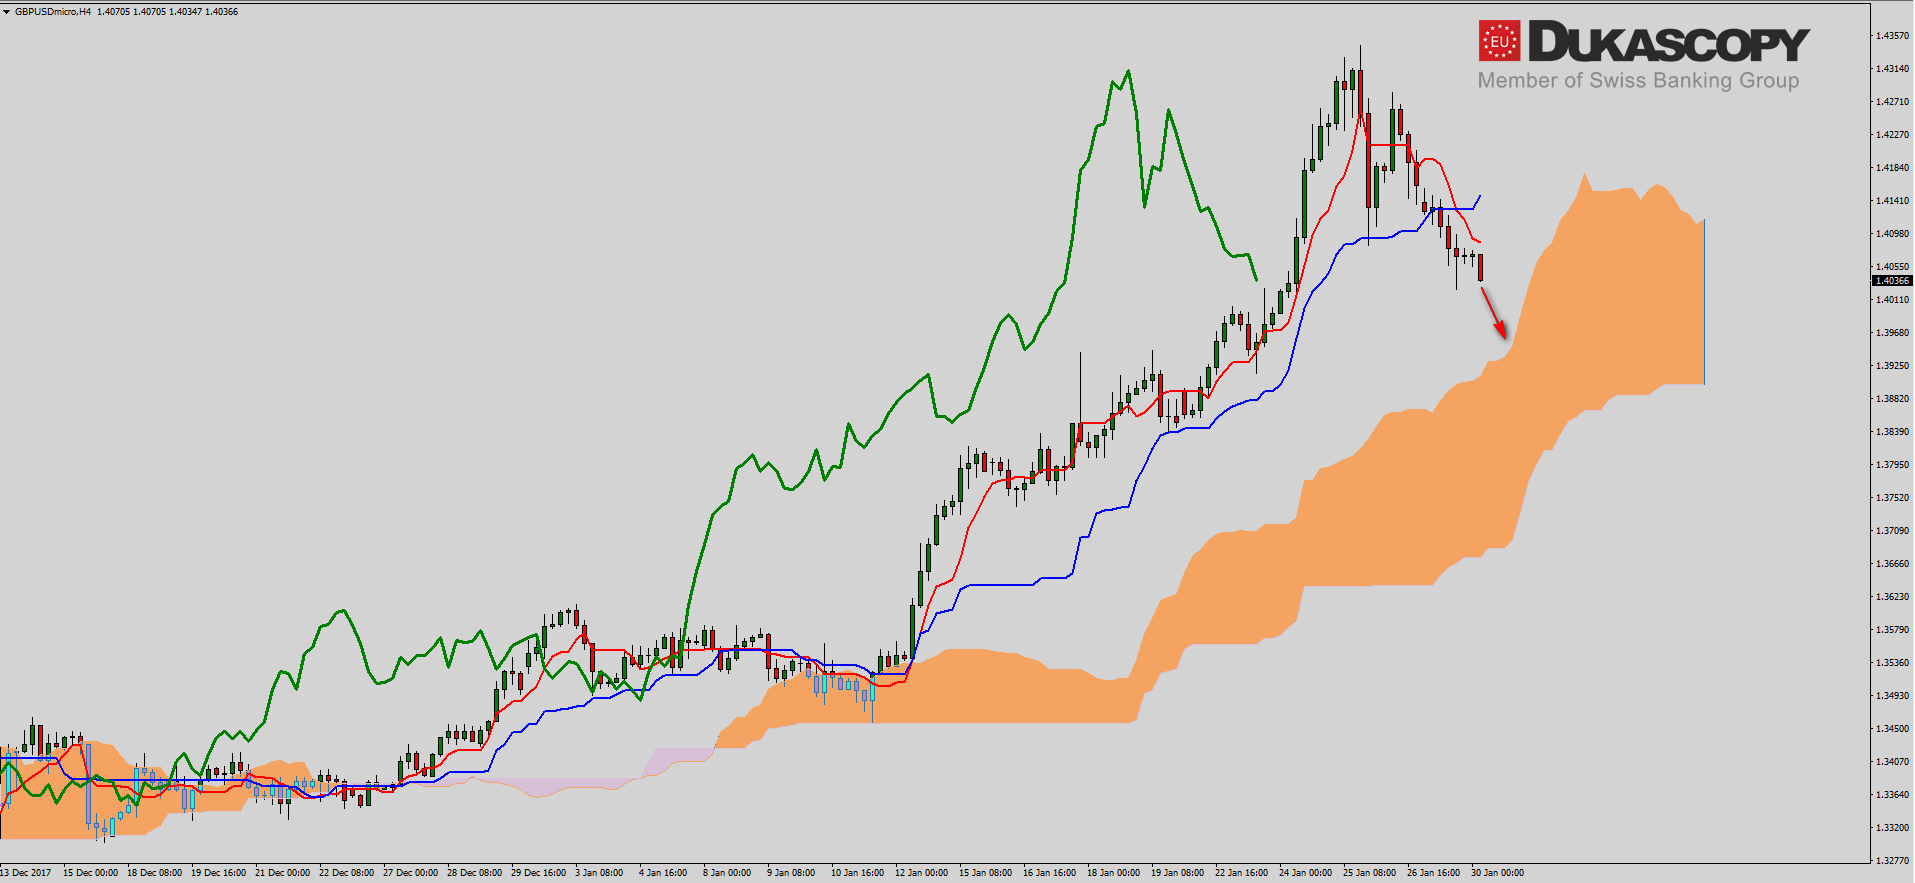
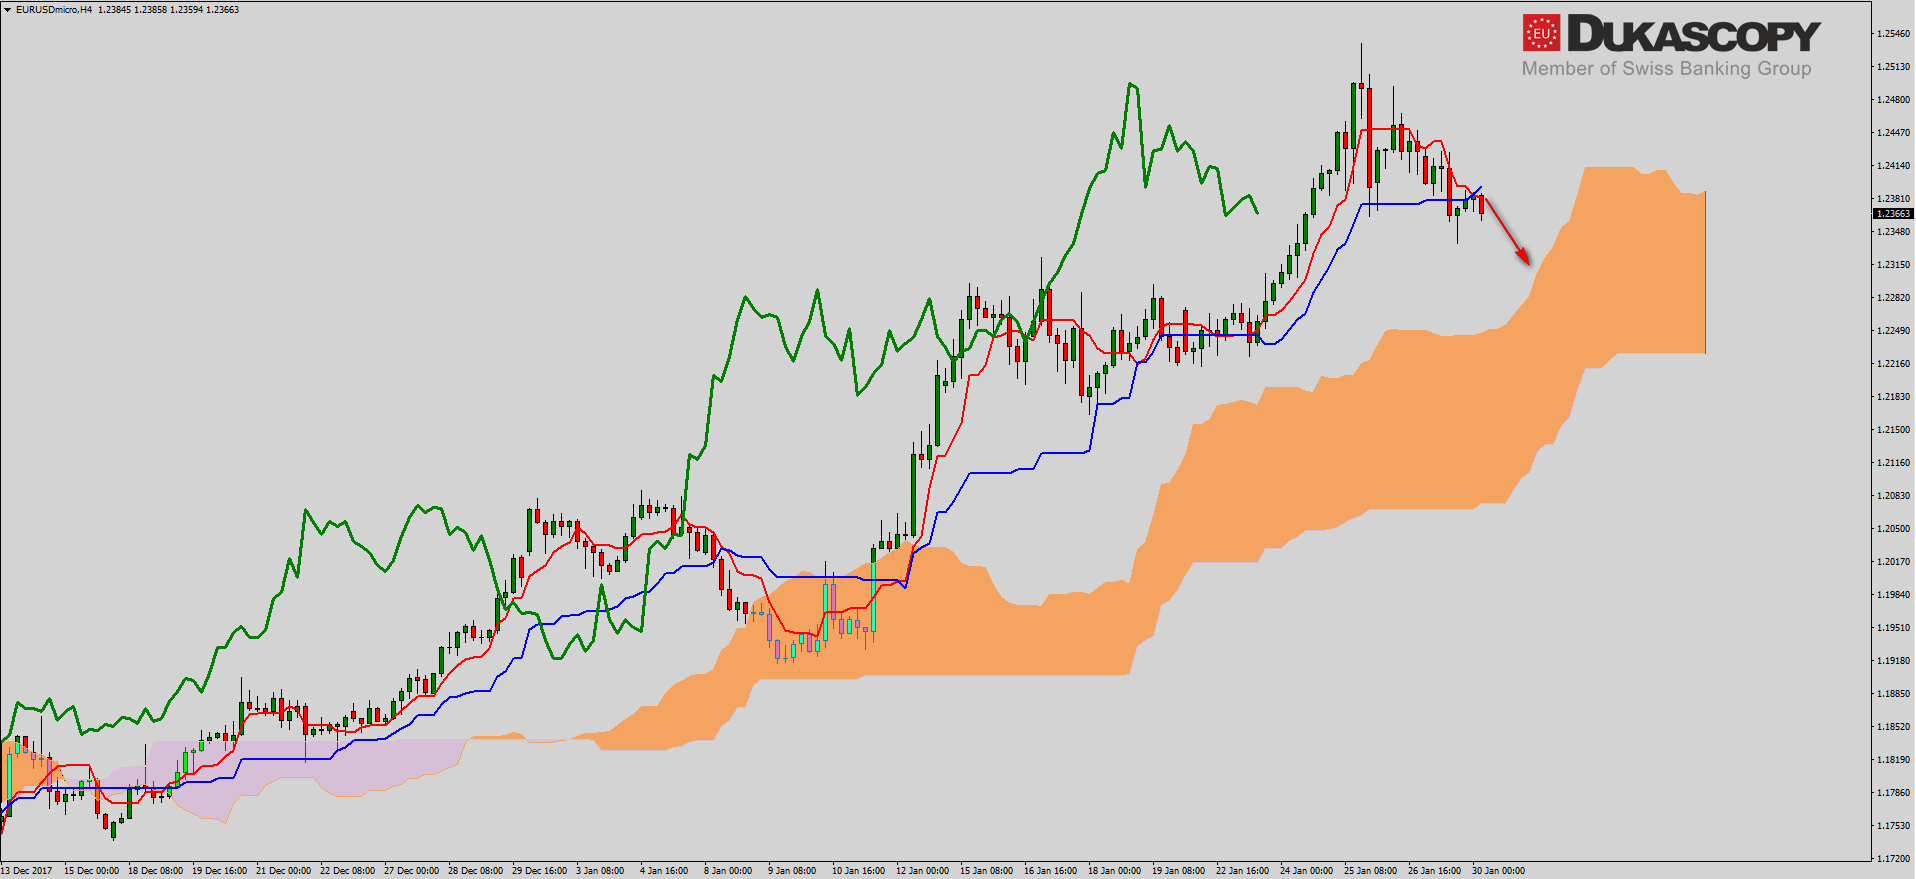 Looking at the H4 graph with the Ichimoku indicator we can see that the pair has crossed the Kijun line and this may mean a larger downward movement towards the Senkou Span A line, which is the upper limit of the growth cloud. In this place there is also support in the form of the recently broken high and there I expect reflection and another growth wave.
The partner of “Search, Analyse, Trade” series is a Dukascopy Europe broker who gives its customers access to ECN accounts in different currencies.
Trade on Forex, indices and commodities thanks to Swiss FX & CFD Marketplace. Open free trading account right now.
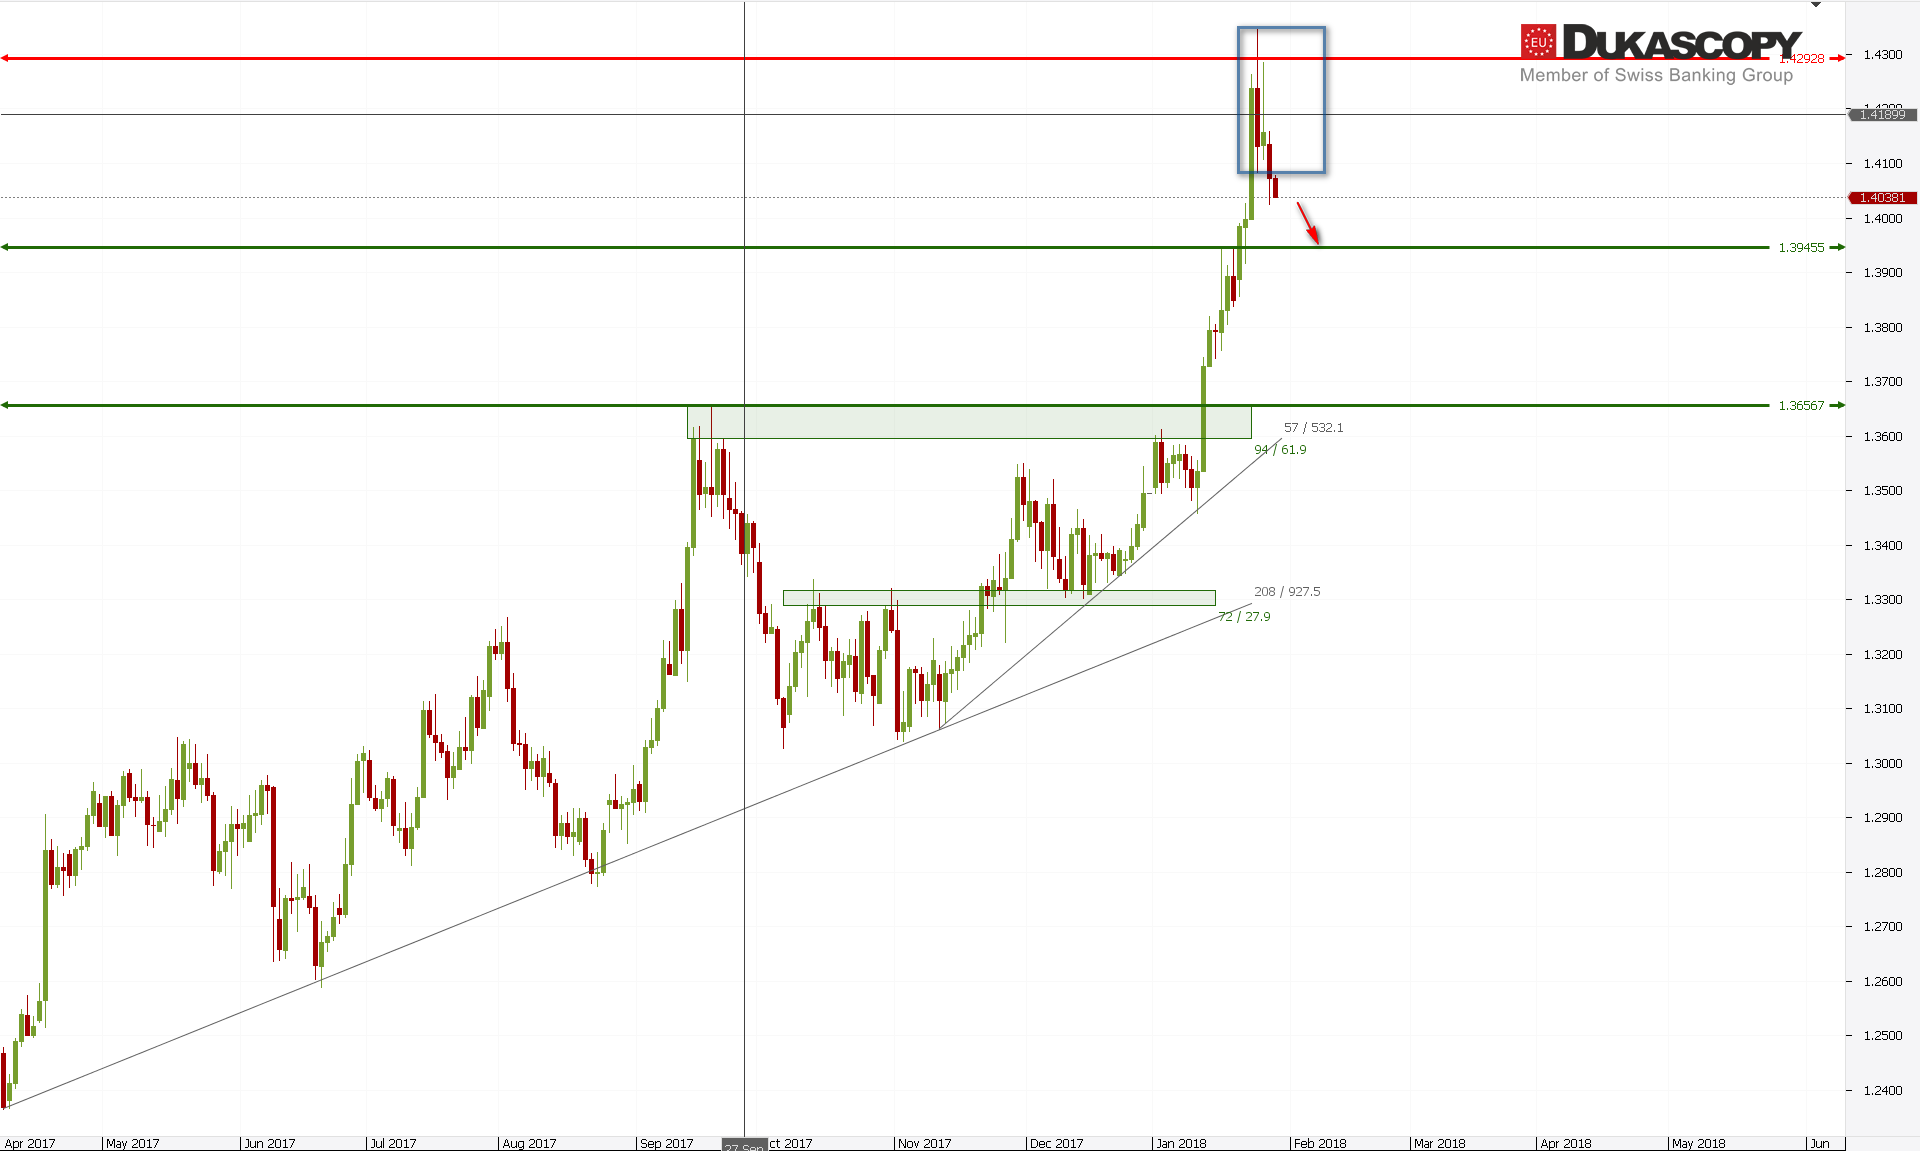
Similar situation we have on the pair GBP/USD. Here, too, we have an unsuccessful attack on the resistance zone. A strong supply candle was created, which led to decrease in the direction of support. Currently, the pair is trying to break down from Inside Bar. If the breaking-out is successful, we should see a test of the demand zone, which is around 1.3960.
 The sentiment suggests longs.
 It is also the Senkou Span B line, the bearish cloud on the weekly chart. It is flat and should attract the price to each other. Also on the sentiment chart we have a similar situation to the EUR/USD pair. Short positions remain constant, while the entire drop we currently see is used to open the longs. On the H4 chart, we see that the pair have crossed the Kijun line. There was a dead cross over the cloud that could lead to Senkou Span A. I count on the demand reaction near the cloud and the appropriate setup to take a long position.
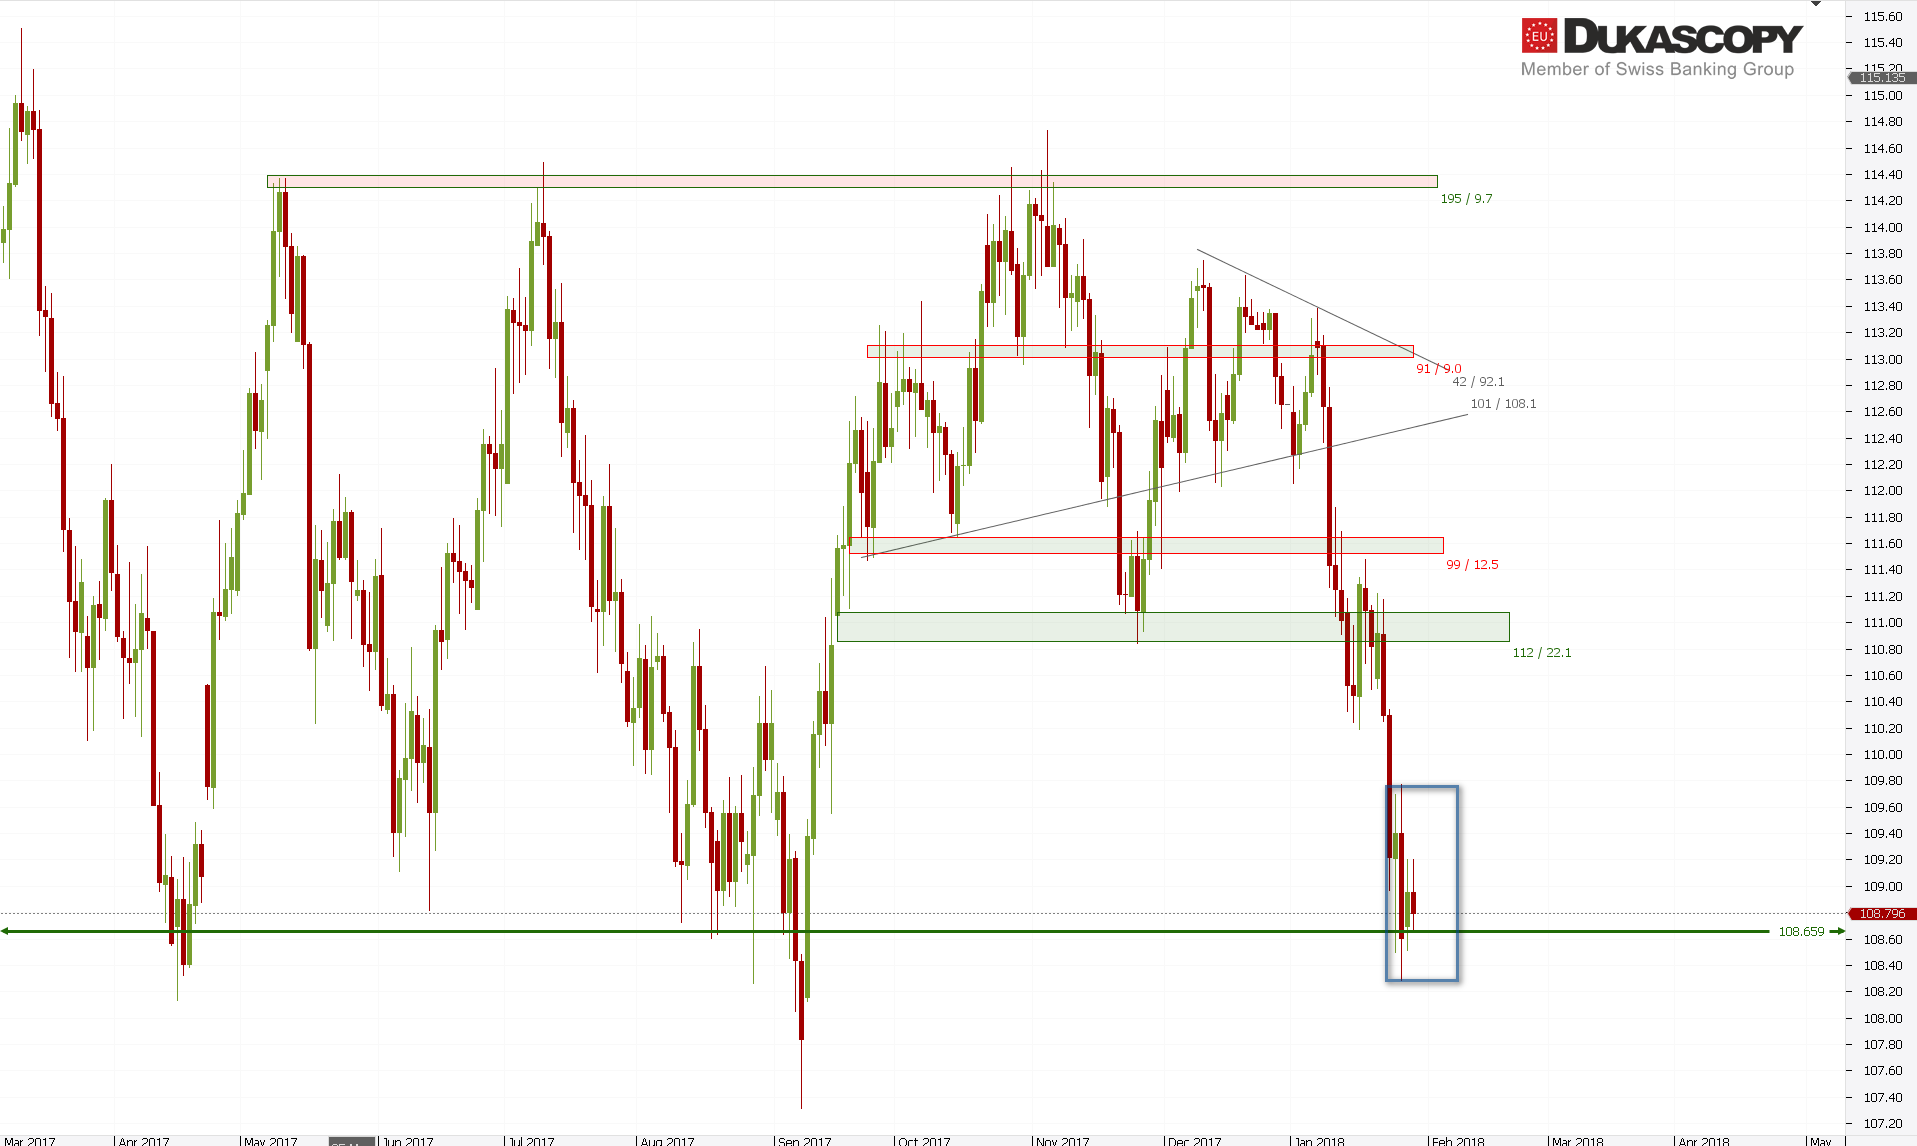 On USD/JPY, nothing interesting has happened since yesterday. The pair remains locked within an Inside Bar just above the support. The last momentum suggests that it is a stop before continuation of the decreases towards the last low.
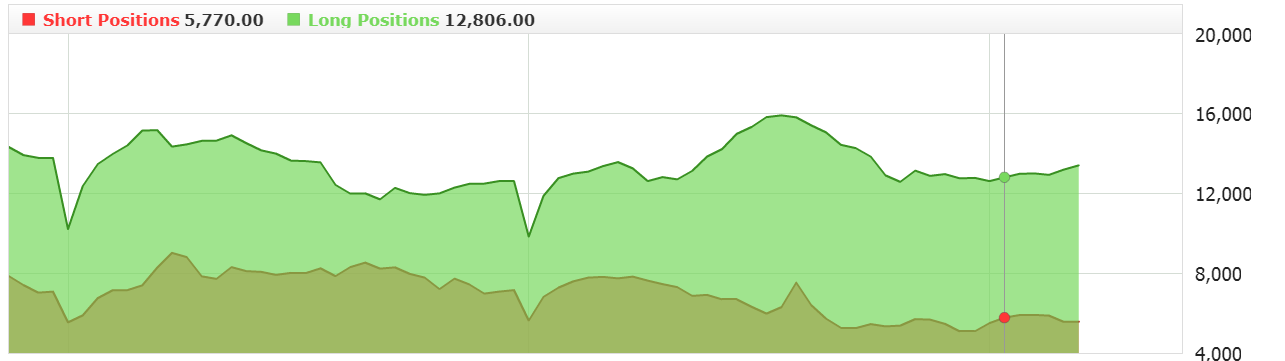 The sentiment from the beginning of the declines is completely opposite to the trend we are watching on the price chart. The long positions are opened all the time or they are averaged. With such a number of longs, attacking the low and defeating it can trigger an avalanche caused by the capitulation of the bulls and closing of long positions.


