“Search, Analyse, Trade” is a series of Price Action and Elliott Waves analyses. Its detailed step-by-step description can be found over here. I invite you to today’s review of selected currency pairs and potential trading opportunities. The analyses are based on the Dukascopy sentiment that you can get here.
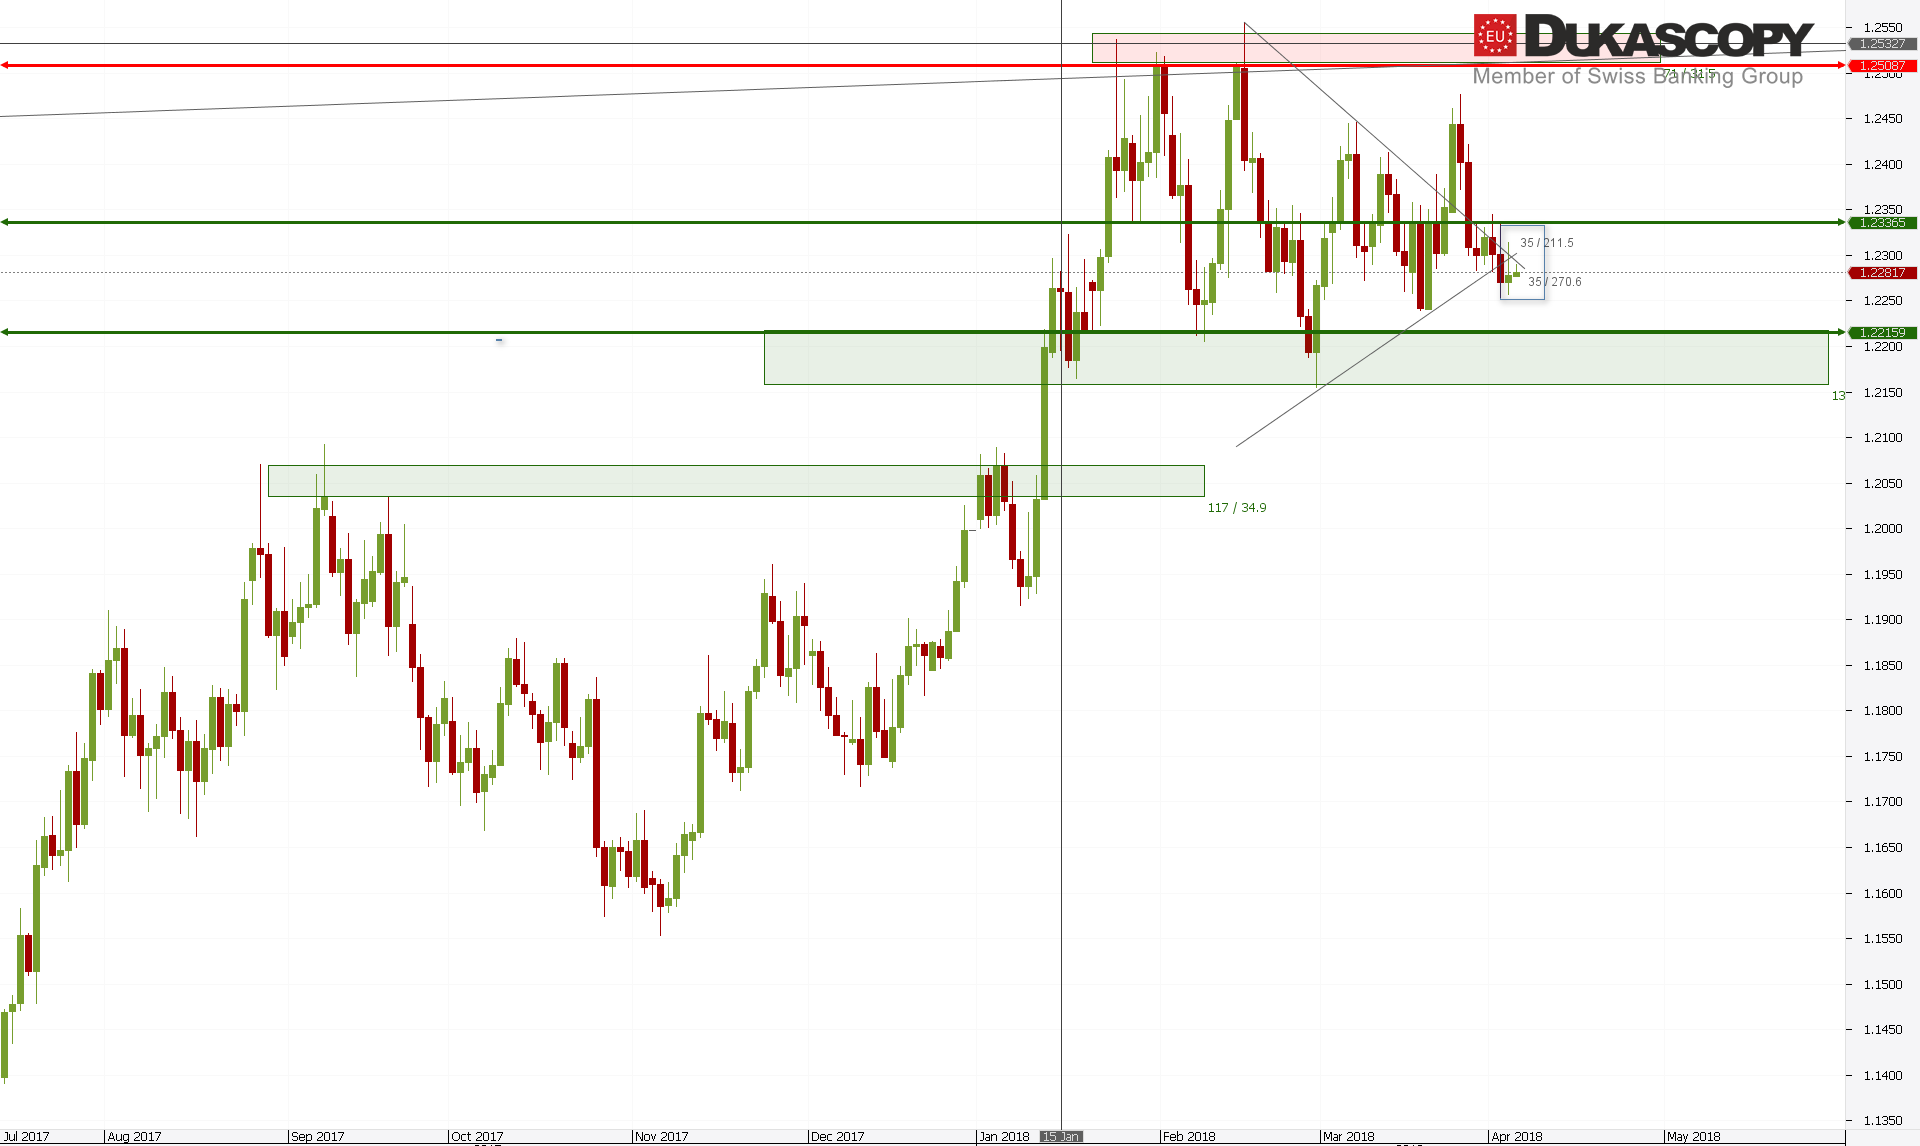 EUR/USD – another Inside Bar was created just below the line extended on lows. The pair still can not decide which way to go. The two scenarios presented yesterday are still valid. Let me remind that the first one assumes continuation of declines in the 3c wave towards the nearest support and if it is a c wave, the corrective structure will be expanded. The second one is the upward movement to vicinity of green line within the b wave of the irregular correction and after its rejection declines under the last low in the 3C wave.
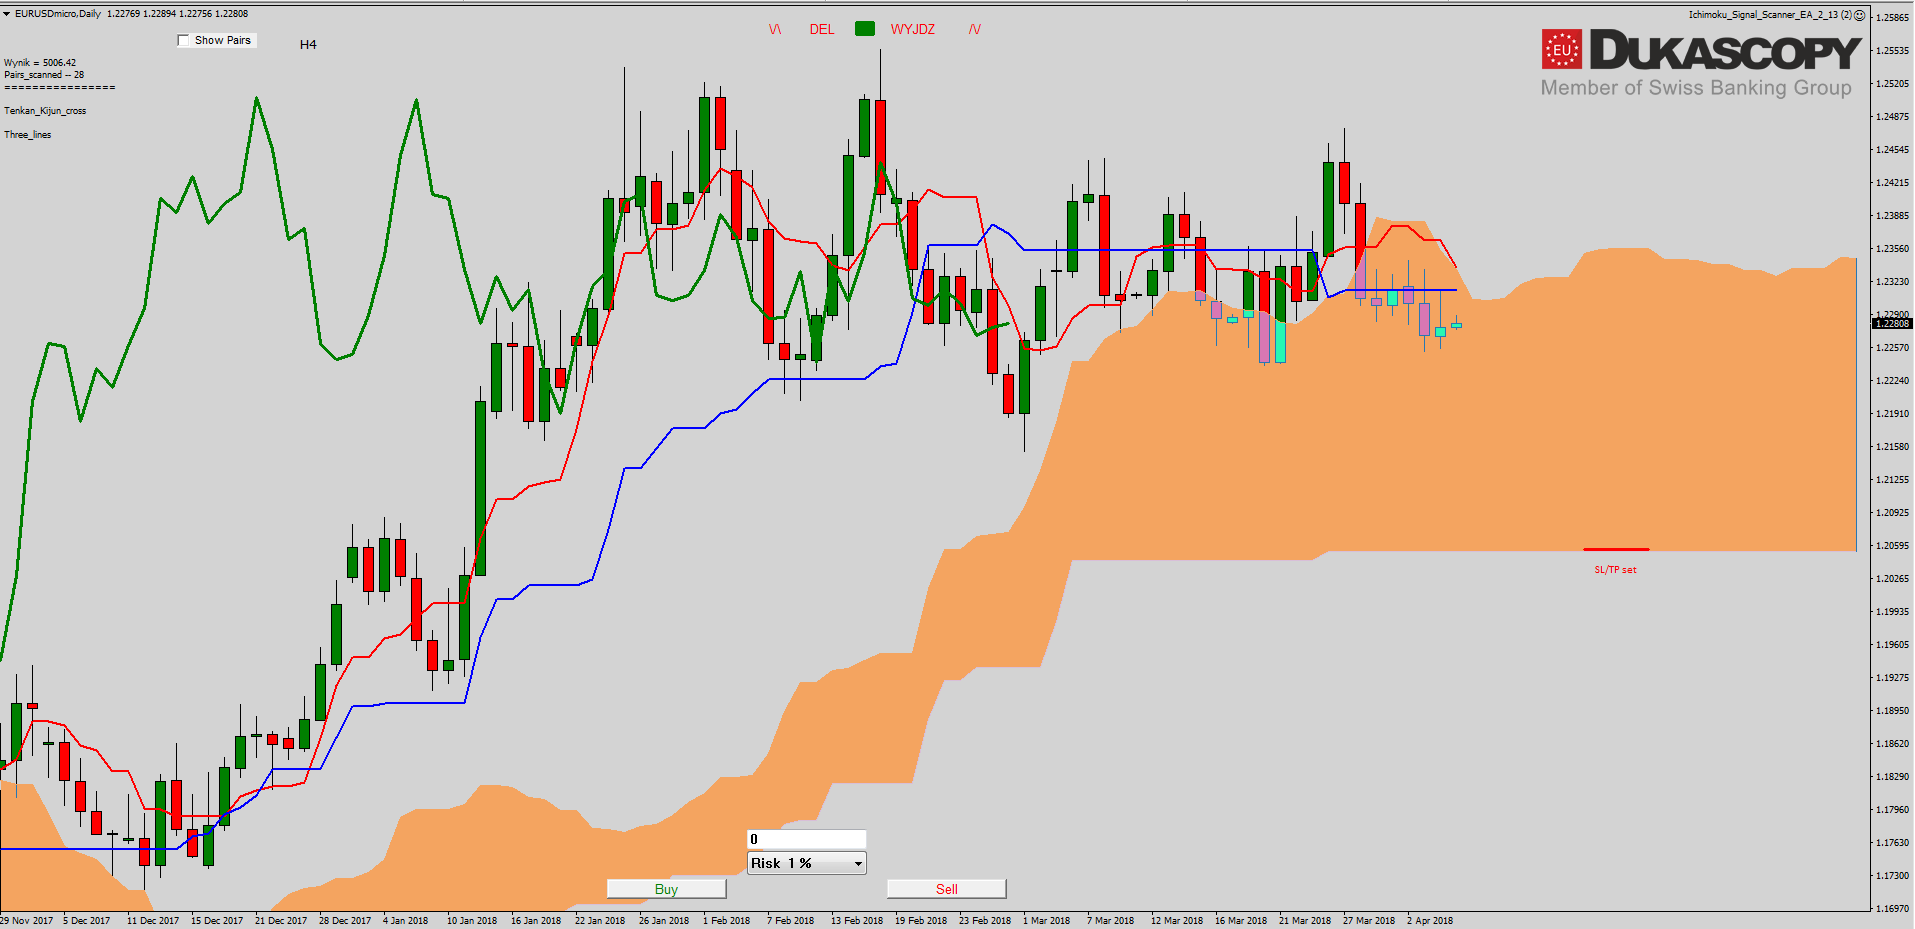
Both Ichimoku and sentiment remain unchanged from yesterday. The pair once again tested the Kijun line from the bottom and rejected it. A Pin Bar was created, which may suggest continuation of declines at least to the last low. The Tenkan line is slowly shifting to a downward trend, and if the pair moves south, it will probably cut with Kijun giving a neutral sell signal.
The partner of “Search, Analyse, Trade” series is a Dukascopy Europe broker who gives its customers access to ECN accounts in different currencies.
Trade on Forex, indices and commodities thanks to Swiss FX & CFD Marketplace. Open free trading account right now.
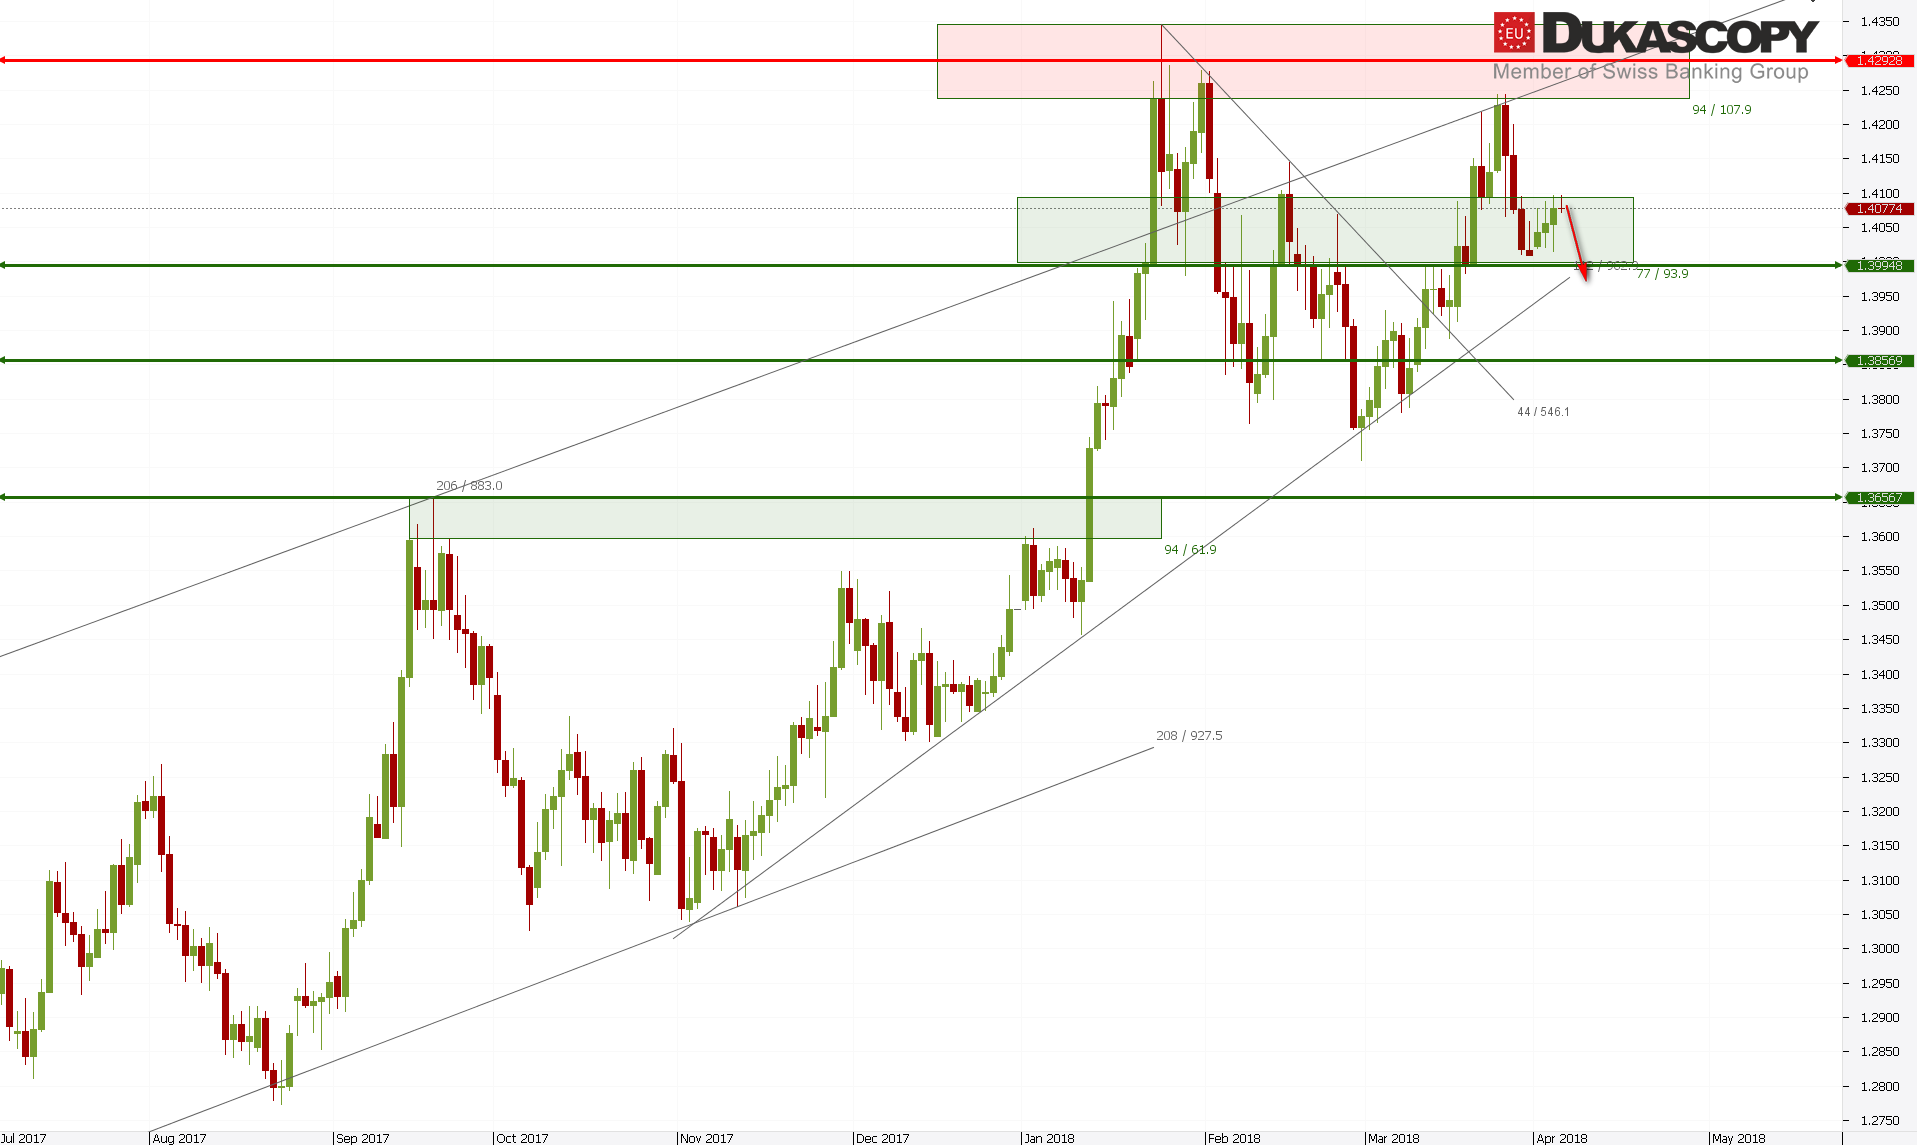
Also, the GBP/USD pair is still. The pair struggles with the upper limitation of the resistance / support zone. All the time this movement looks corrective and I would expect more declines in the c-wave correction of the last growth impulse than the attack on the top of current levels. If the pair rejects the level, the minimum goal for possible declines will be the accelerated trend line.
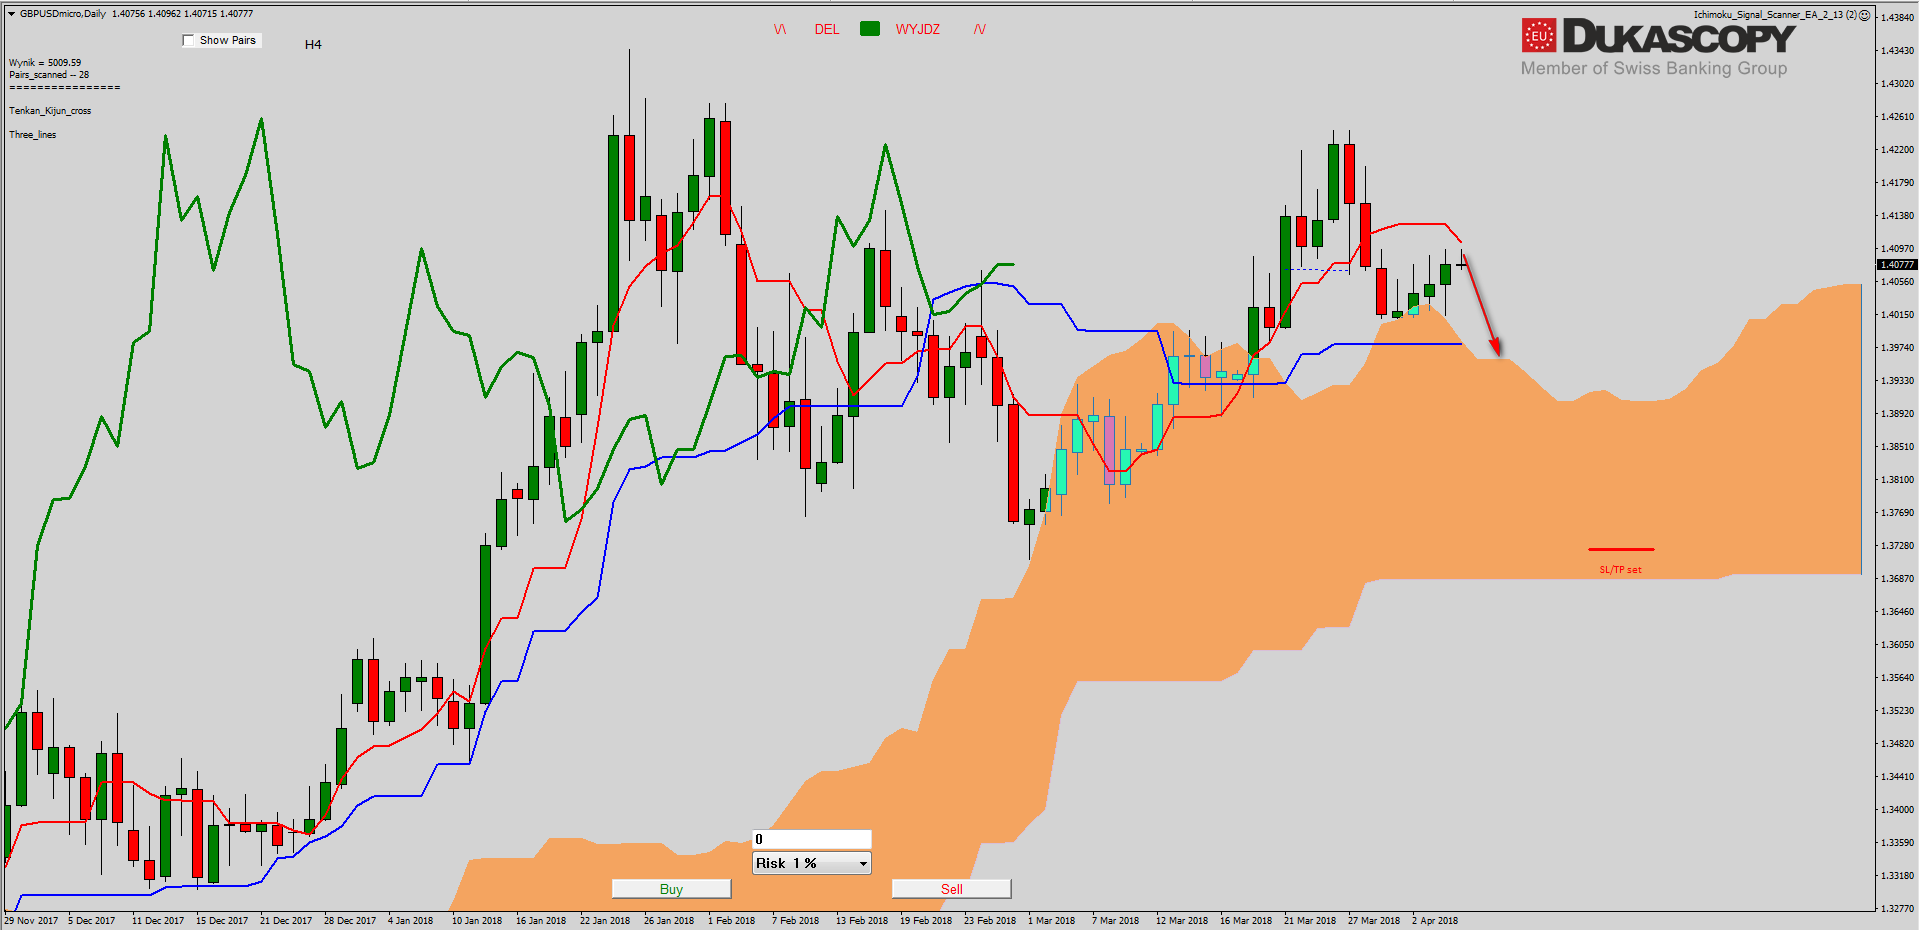
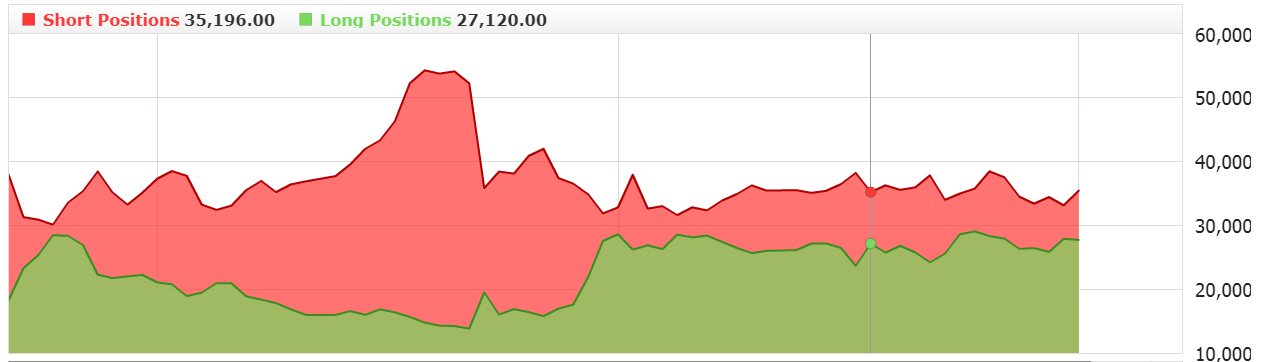
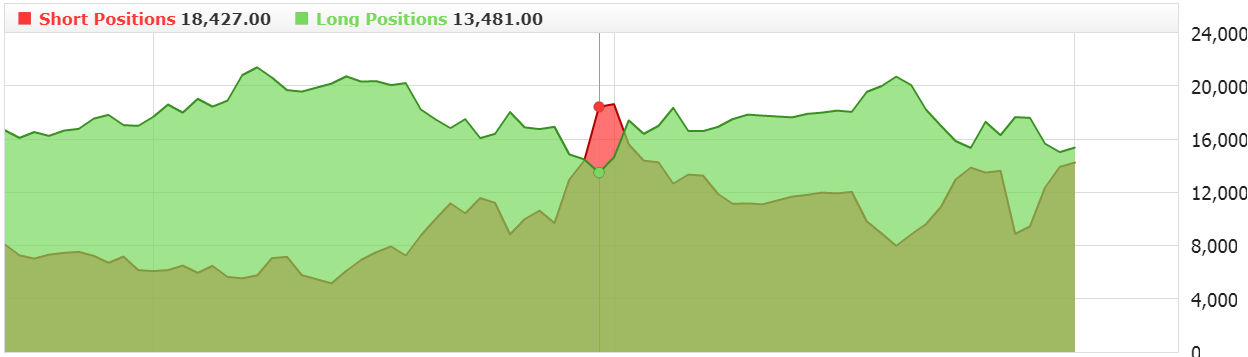
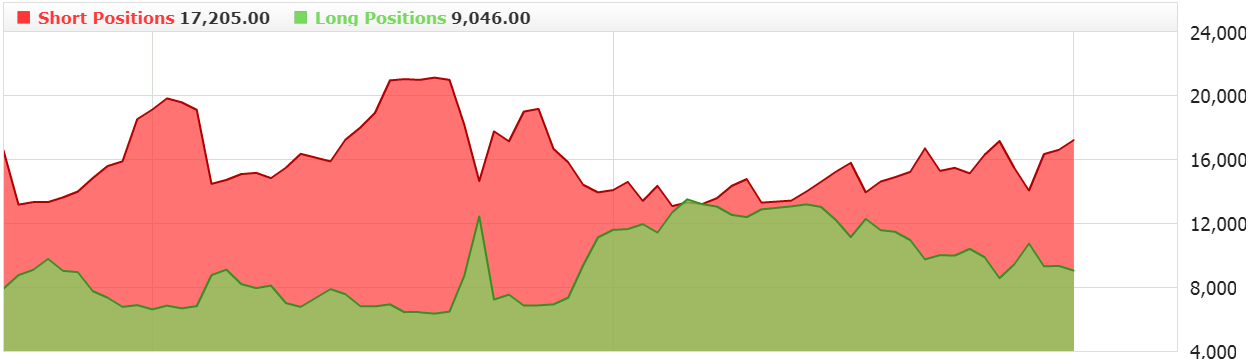 On the Ichimoku chart the pair is still between the lines Tenkan and Kijun. The Tenkan line slowly changes direction to bearish. The price is right below her and we should see her test in the near future. If pair rejects the line, continuation of the correction towards the flat line Kijun and Senkou Span A will be very possible. Such a scenario is fostered by sentiment, which slowly begins to move to the short side. I am counting on the test of these lines, i.e. formation of a impulse correction c wave, and only then I will look for a trade compatible with it.
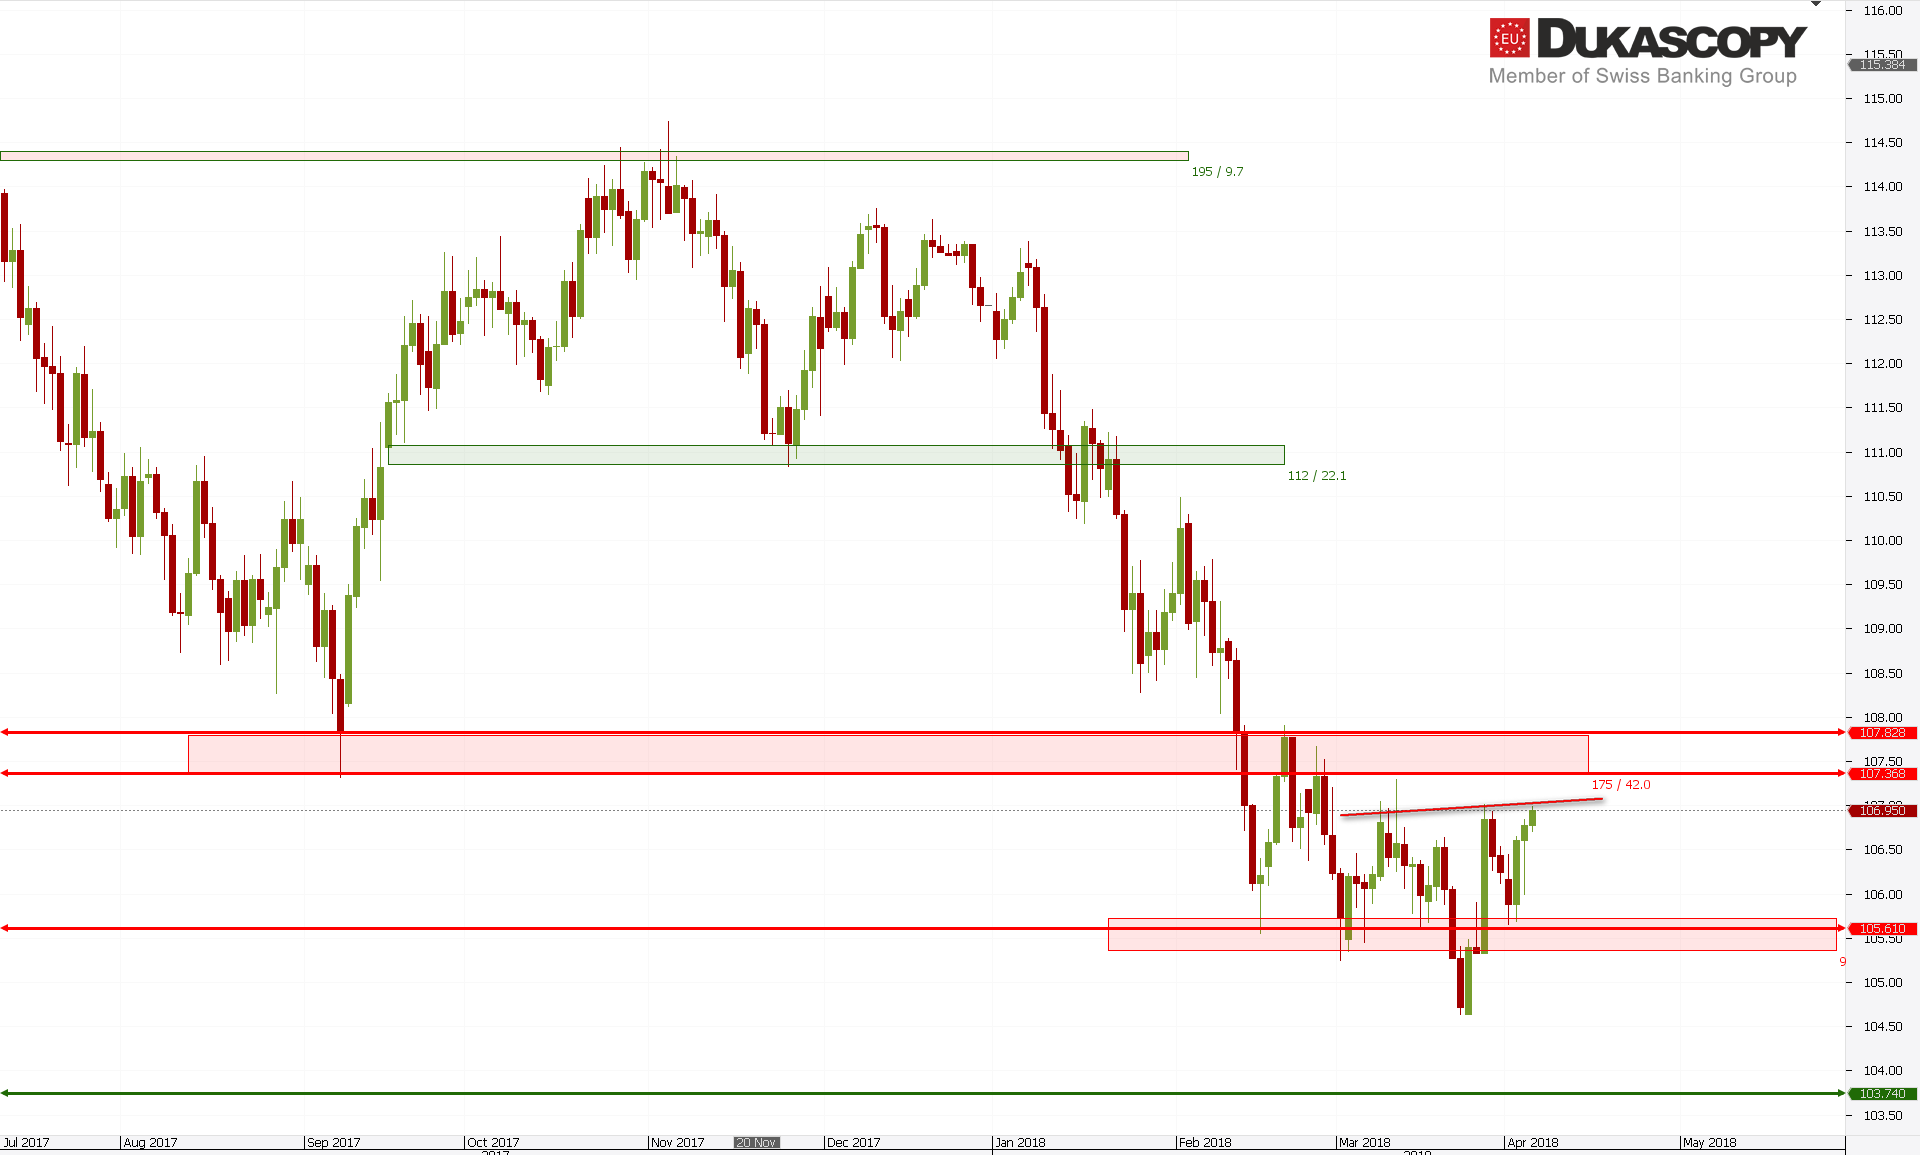
The USD/JPY arrived at the yesterday mentioned neck line of the hypothetical formation of the inverted head with the arms. If this line is defeated, the pair should break through the key resistance zone and try to reach the range of the formation. However, if these levels are rejected again, then we will have a ABC correction. In this case, either we will see the continuation of declines, or the lateral movement will stretch over time.
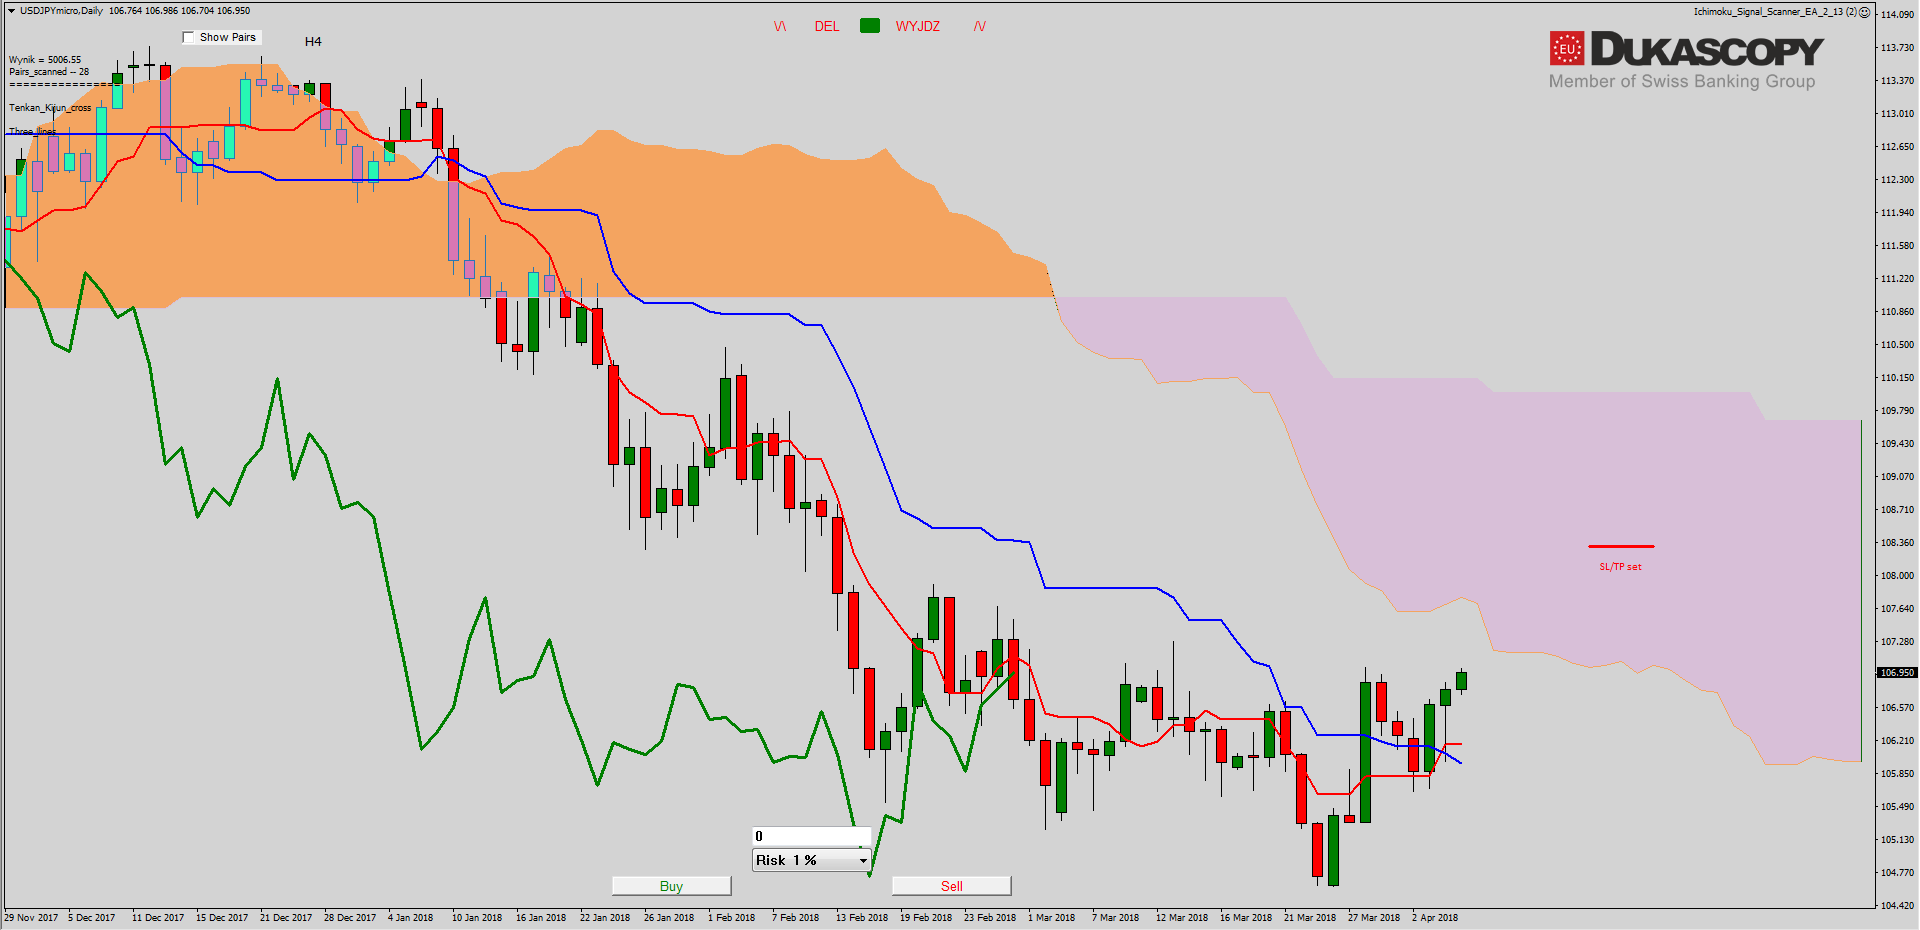
 On the Ichimoku chart, the pair rebounded from the Tenkan line to form a Pin Bar. There was a cross under the cloud, which is a weak buy signal, especially that both lines are not bullish. The Chikou line has reached the price line and will probably try to defeat it. If it works, the move towards Senkou Span A will be as possible. The sentiment remains neutral and allowed to enter the position at the re-test of the Tenkan line. The target for such a position is the mentioned Senkou Span A.


