After reaching this year’s maximum in February, the price of gold is steadily falling. Currently, we are at 75 US dollars (USD) below the maximum levels. Last week the key support was also broken, which may result in further declines, even in the direction of $1250 per ounce of gold.
The technical situation on the gold
The technical situation on XAU/USD does not look attractive for buyers. After breaking the zone at $1278, there is a chance for further declines. In addition to the classic technical analysis, the head and shoulders formation (H&S) can be observed, which announces a reversal of the trend. Therefore, as long as the odds are below the resistance zone at $1278, I do not see a chance for an increase.
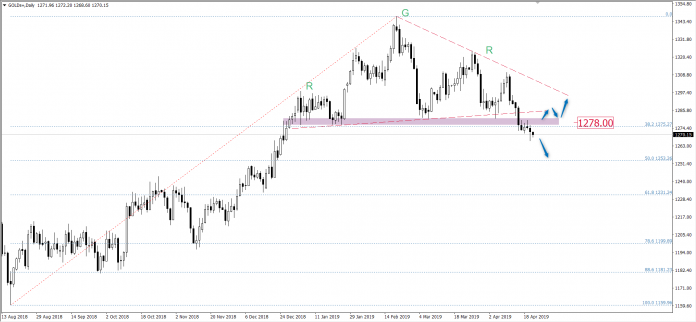
Currently, the target for short positions can be 50% Fibonacci, i.e. half of the last upward wave. However, there are always two scenarios to consider. A possible return above the resistance zone may lead to dynamic growth.
In the lower interval, the downward trend is maintained
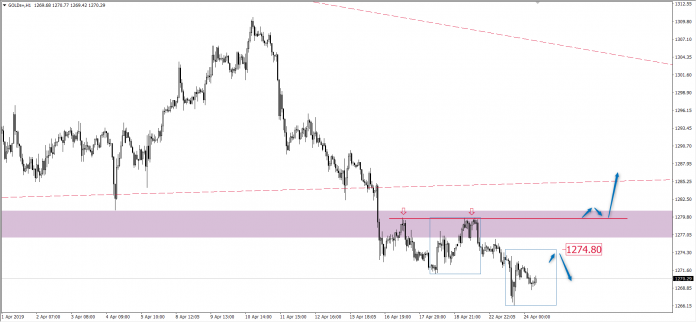
The lower time interval shows that the market does not have the strength to exit above the resistance zone I mentioned in the higher time interval. Only when breaking through the level marked with a red line, one could think of long positions. Earlier resistance should be the upper limit of the Overbalance system at the level of 1274.80$. At today’s session there is a chance for an upward correction, but let’s remember that the trend is downward.
Join us in our Price Action Patterns group for serious traders, get fresh analyses and educational stuff here: https://www.facebook.com/groups/328412937935363/


