The daily chart is overbought and in a resistance area. The odds are that it will pull back for at least a few days, and the pullback should begin this week. The candlestick pattern today on the daily chart was a bear reversal bar and a sell signal bar for a 2nd entry short for the failed breakout above the September high. Since it was a doji bar, it is less reliable, but the odds are that the EMini will trade down for at least 2 – 3 days soon. Targets for the bears are last week’s higher low, the moving average, and the gap around 1950.
Bulls will buy every reversal attempt. If this rally is in fact a reversal of the bear trend, the bulls might be successful. It is more likely a rally in a trading range, and therefore it is more likely they will be disappointed by a pullback starting in the next few days.
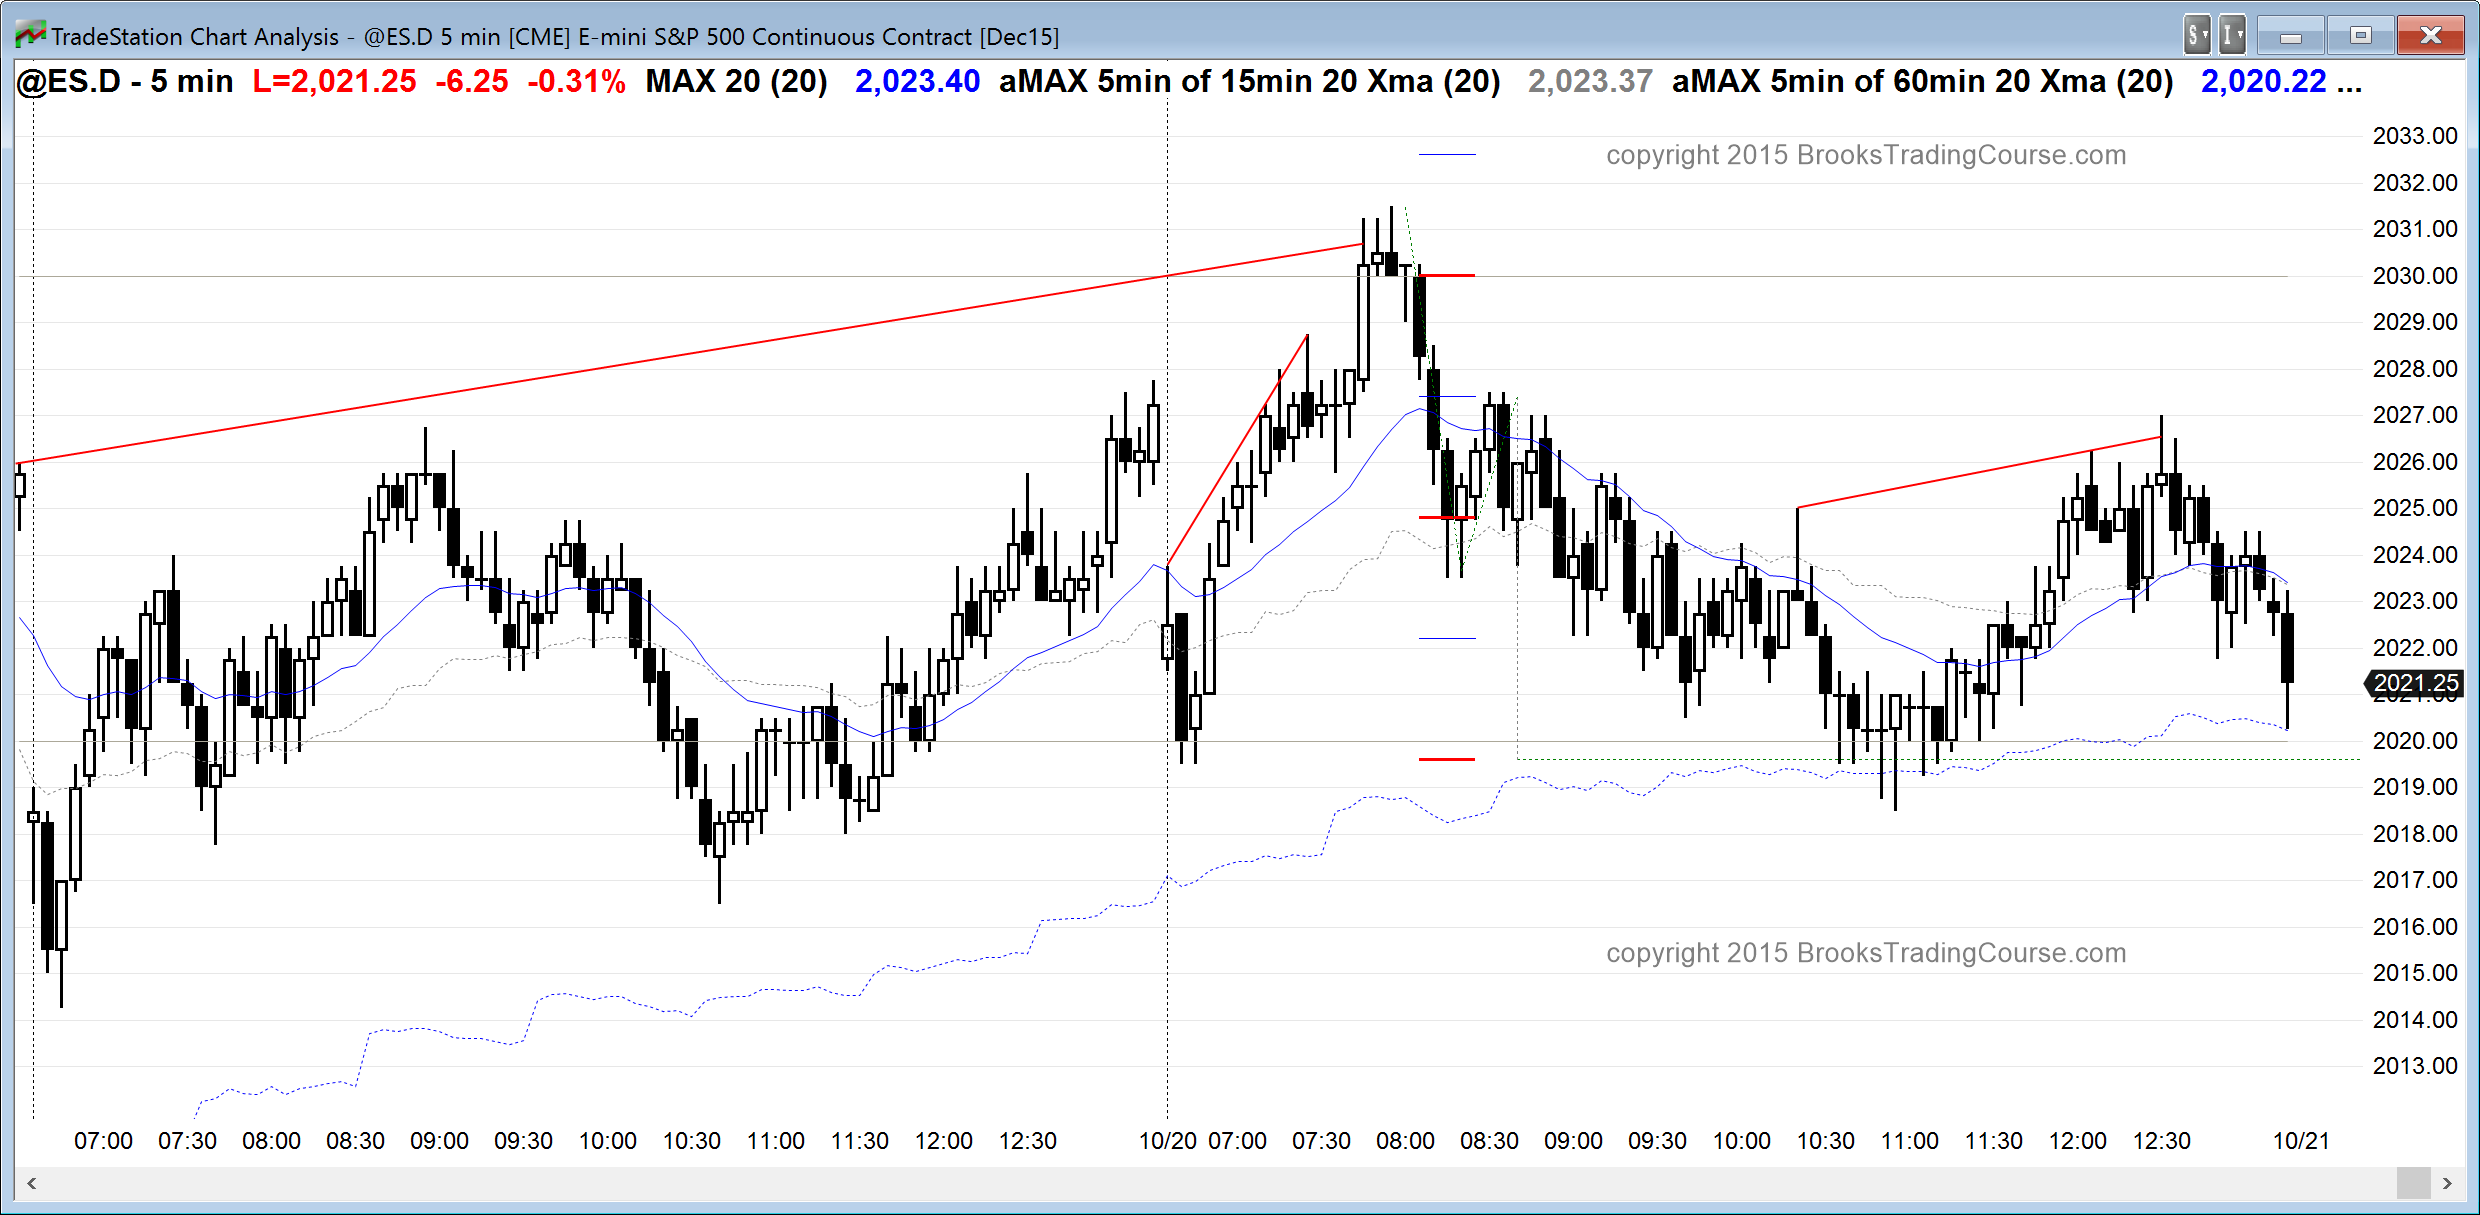
Original post was published at Al Brooks Price Action Trading Blog. Check Brooks Trading Course and get The most comprehensive source of information on price action trading available!


 Review")


