Monthly S&P500 Emini futures candlestick chart: Possible double top
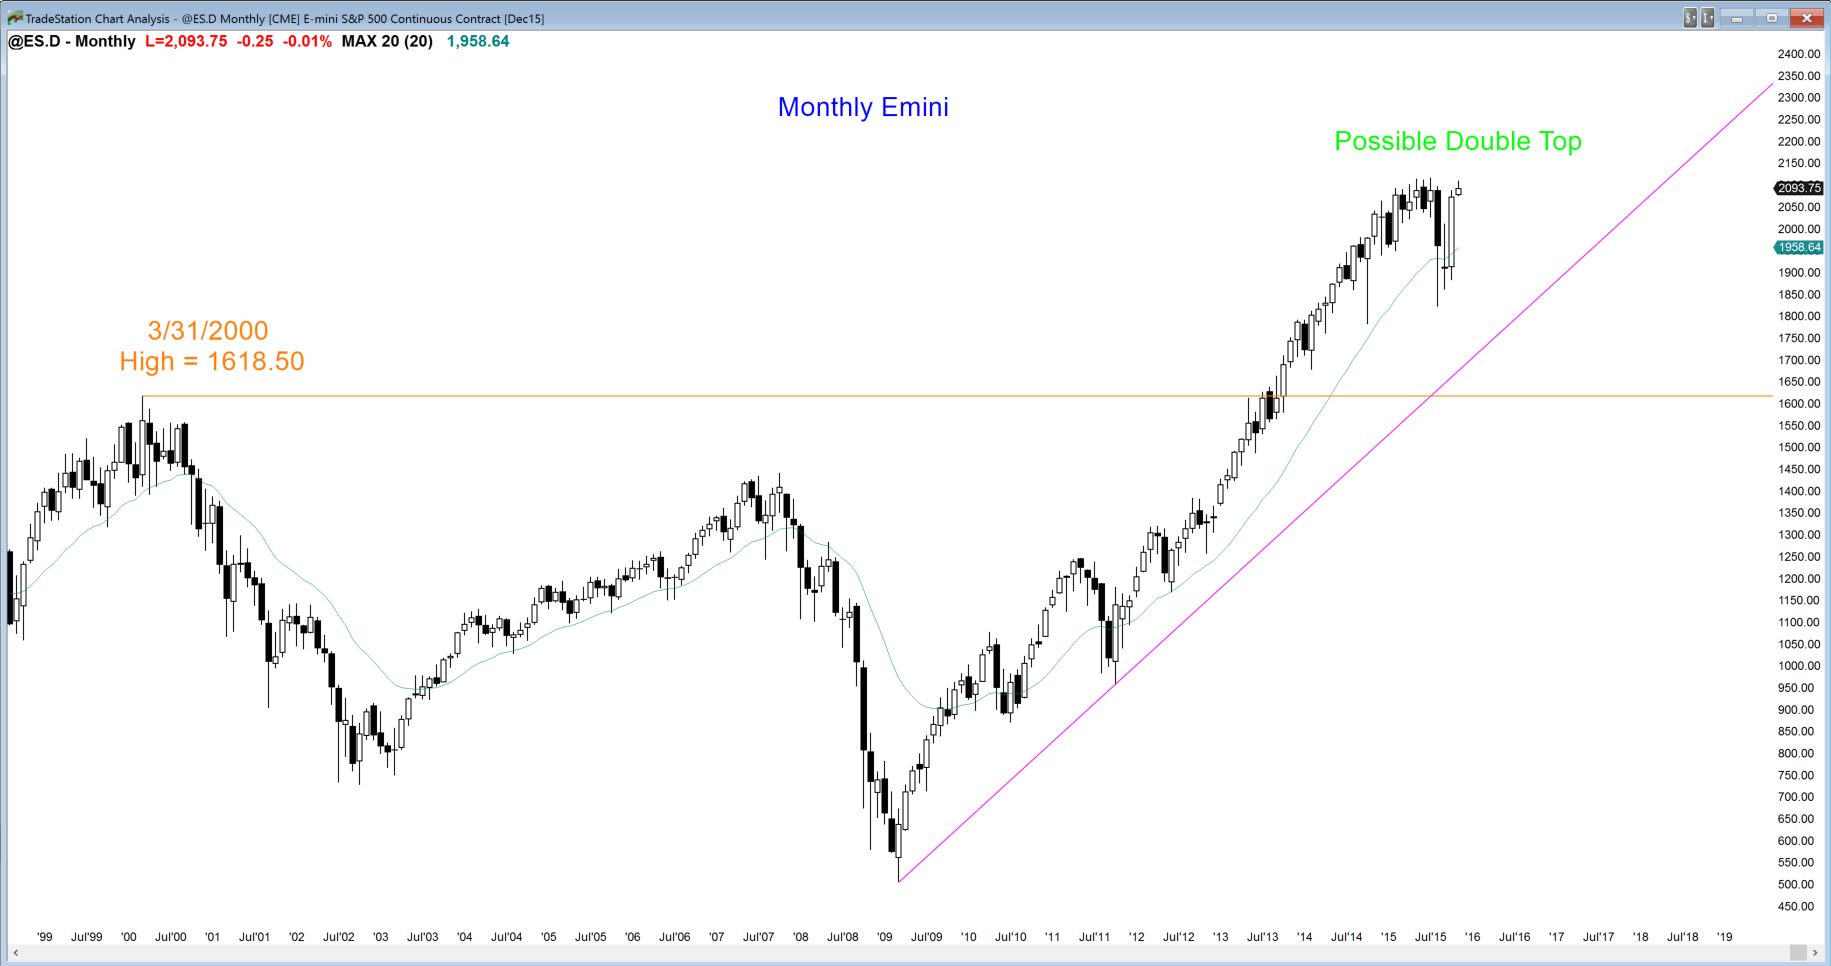
The monthly S&P500 Emini futures candlestick chart reversed up strongly from its moving average in October, but the signal bar was a doji. This increased the chances that the rally will be part of a trading range that could last several more months. The bulls want a strong breakout to a new all-time high. However, after 38 months without touching the moving average prior to the August pullback, the monthly chart is still overbought. This limits the upside potential over the next several months. Bulls correctly argue that 38 weeks without touching the moving average is a sign of a strong bull trend. It is also extreme behavior, and therefore climactic.
When there is a strong buy climax, bulls take profits. The market usually needs 5 – 10 bars of sideways to down trading before the bulls will aggressively buy again. They want to give the bears a chance to drive the market down so that the bulls can buy lower. Whether or not the bears succeed, after about 5 – 10 bars, the bulls begin to buy again. In the meantime, the absence of strong buying usually results in a trading range, which is what is likely for at least a couple more months.
Weekly S&P500 Emini futures candlestick chart: Overbought, just below the all-time high
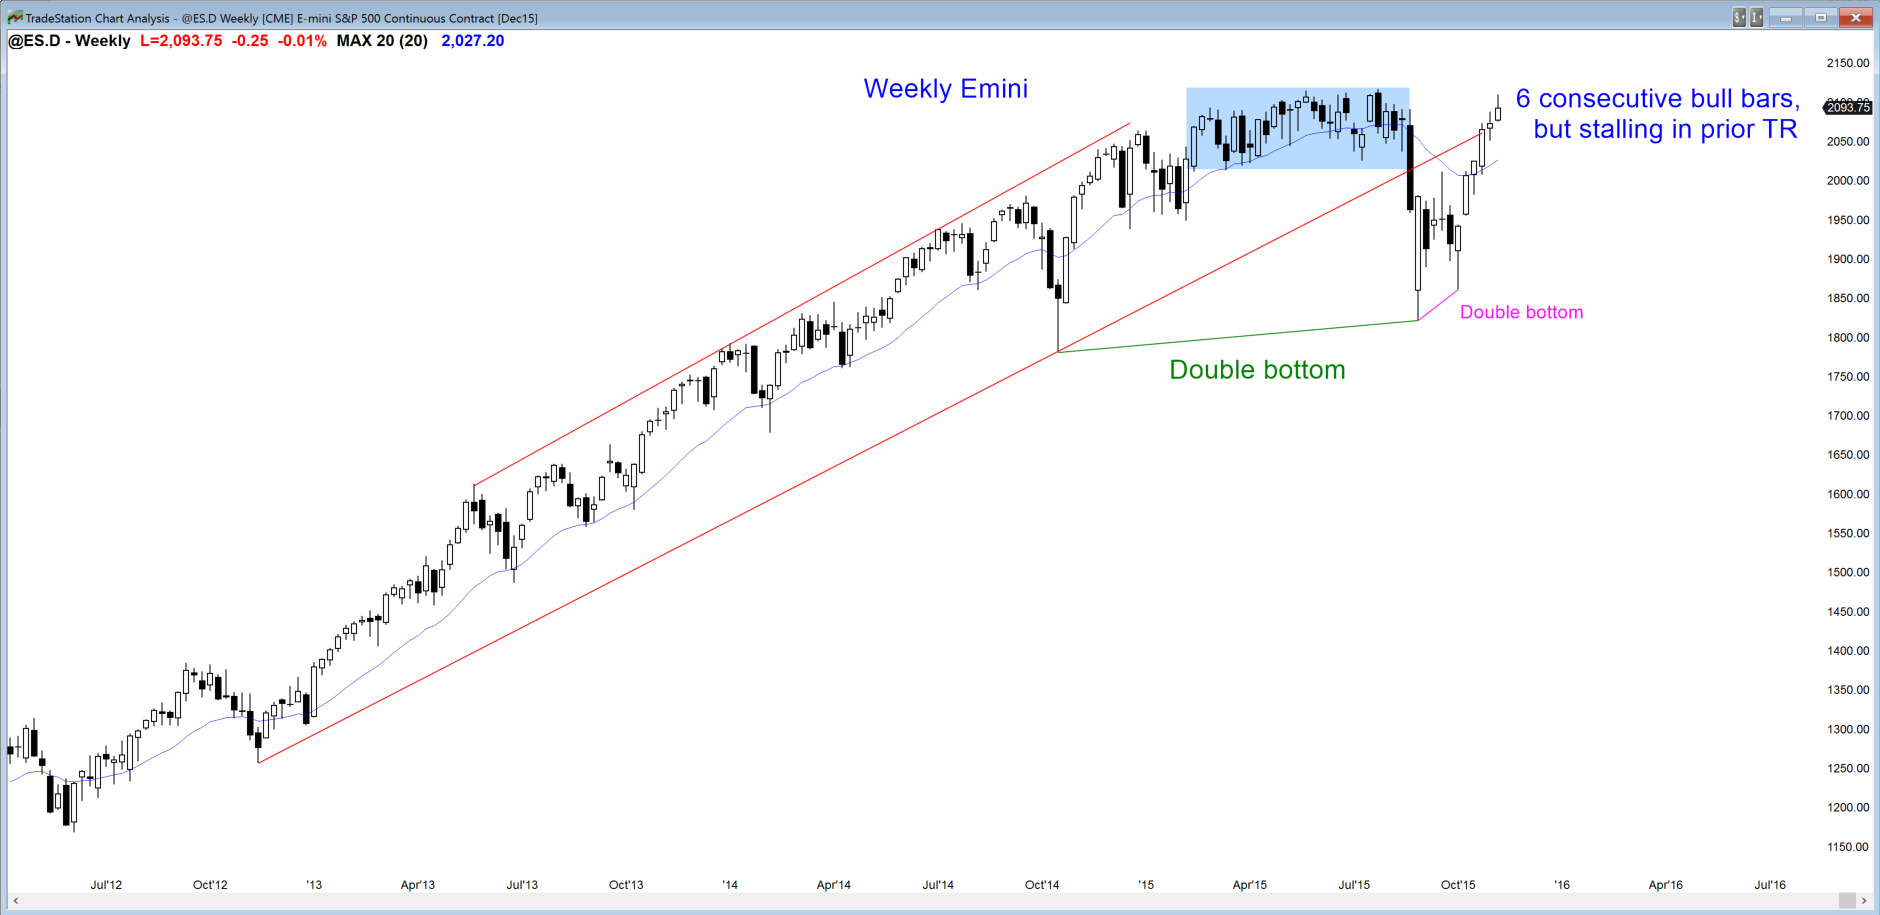
The weekly S&P500 Emini futures candlestick chart has 6 consecutive bull bodies, which his extreme. Last October’s rally that reached a new high had 5 consecutive bull bars, and then a couple of sideways bars that were followed by a 90 point pullback. No one knows if this year’s rally will pullback that far, but it is overbought and a 50 point pullback is likely soon. Also, the Emini is back inside its earlier 7 month trading range. That increases the chances of more trading range price action over the next few weeks.
Six consecutive bull bars is extreme. However, the bulls will probably buy the first pullback. This means that if next week trades below this week’s low, the bulls will probably by the selloff. The selloff probably will not last more than a couple of weeks before the bulls get a test back up to this week’s high. If the bulls continue to fail to reach a new all-time high, at some point they will decide that they are holding positions that are probably overpriced. They will begin to sell out and look to buy lower. Once bulls start to sell, there is no one left to buy, and the Emini could then correct down for several weeks.
Just like the 7 month trading range was a magnet that prevented the bear breakout from staying down for long, it will also probably be a magnet that will prevent a new all-time high from lasting long or going far. When a tight trading range forms late in a bull trend, it often becomes the final bull flag. Bulls often use the new high to take profits instead of a sign of strength that needs to be bought. Bears will also sell the bull breakout, betting that the magnetic pull of the 7 month trading range will prevent the rally from lasting more than a few bars (weeks) before it fails and the Emini falls back into the trading range.
Daily S&P500 Emini futures candlestick chart: Learn how to trade consecutive buy climaxes
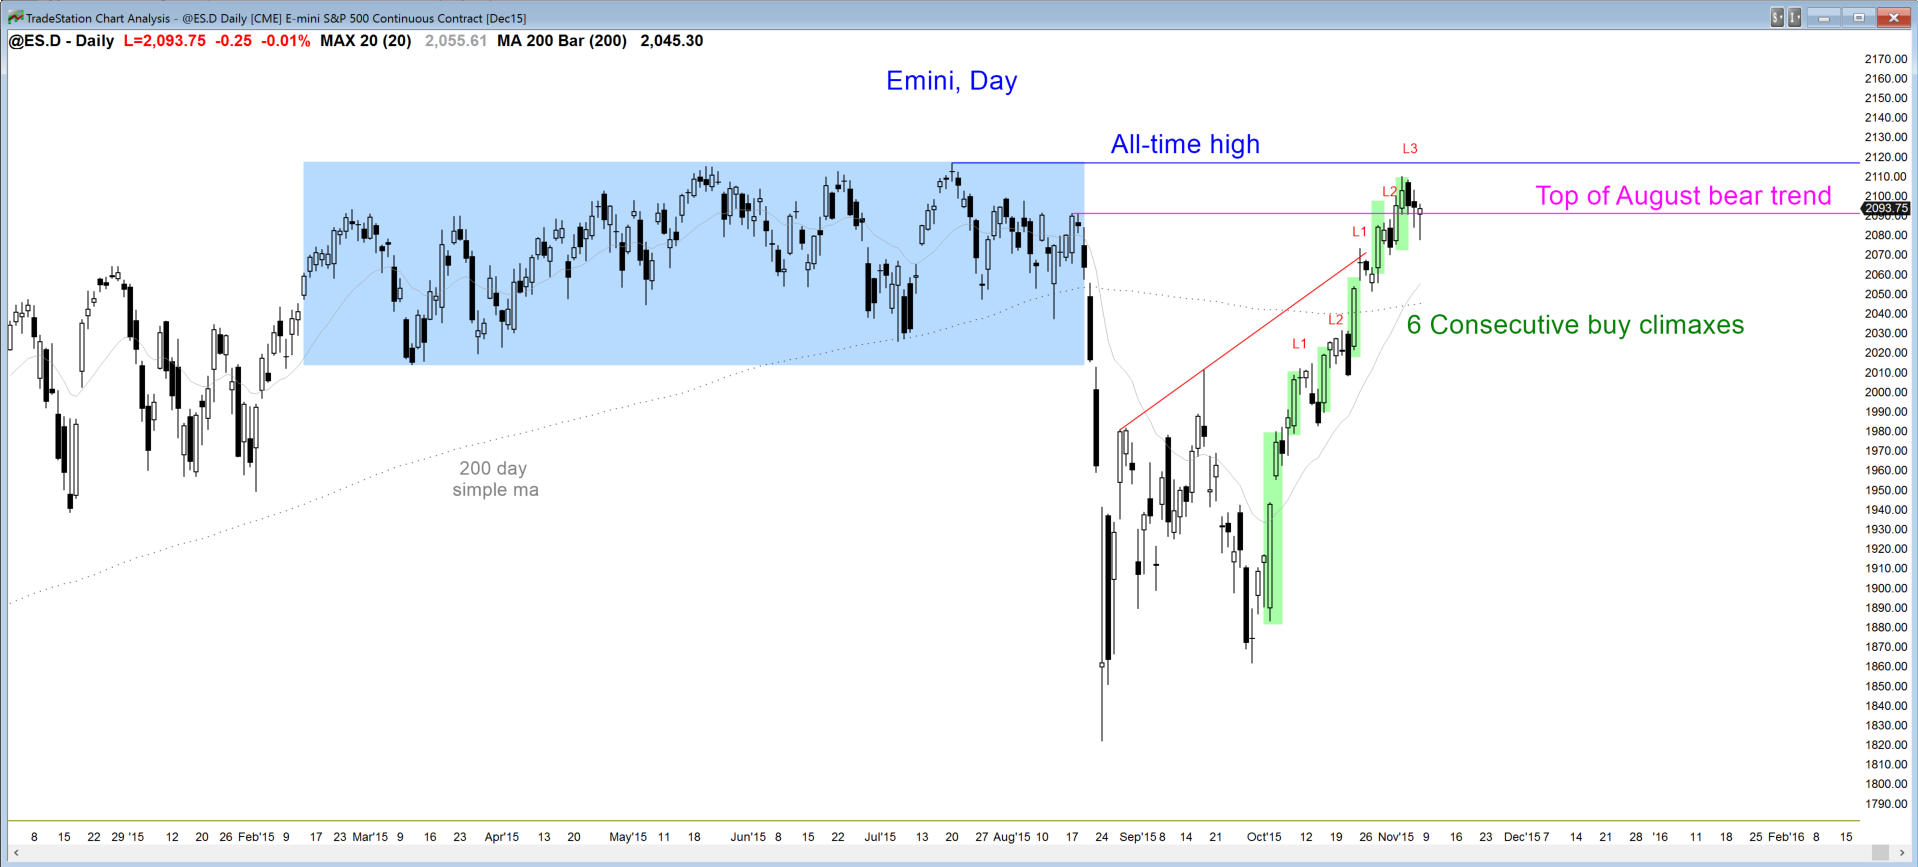
The daily S&P500 Emini futures candlestick chart has rallied strongly for 6 weeks. However, the rally contains 6 consecutive buy climaxes without much of a pullback along the way. That is more common in a bull leg in a trading range and less common in a bull leg in a bull trend. Also, the rally is a variation of a Low 4 sell setup. The bulls twice tried to reverse the Emini around the September high, but the 2nd top was followed by a bull breakout. The breakout had 3 pushes up to form a Low 3 top on Wednesday. A Low 2 + Low 3 is a Low 5, and it is a variation of a Low 4 top. The market twice tried to top, and each attempt contained 2 or 3 smaller attempts to reverse down. This has at least a 50% chance of a couple of legs sideways to down, especially since the Low 4 also has consecutive buy climaxes and it at the resistance of the all-time high.
The 2nd top had 3 pushes, which is a wedge top. Friday was a buy signal barand Monday probably will trigger the buy by going above Friday’s high. When a market turns down from a wedge top, like the Emini did on Thursday, it often tests back up to the top of the wedge. The bulls often get a breakout above the wedge top. When they do, in general, they have a 50% chance of a measured move up based on the height of the wedge. The bottom of the wedge is the October 27 low, which means that the wedge is about 60 points tall. If the bulls succeed, they will look to take profits around 60 points above this week’s high.
There is also about a 50% chance that the bull breakout above the wedge top will fail. If so, the target is the same as the original one for the bears who entered below Wednesday’s low. The bears want a test of the bottom of the wedge, which is around 2050. The selloff usually has at least a couple of legs, and it will probably last about 10 bars, or 2 weeks.
In general, the probability for the bulls and bears is about 50% when there is a breakout above a wedge top. The probability is probably slightly higher for the bears in this case because this top formed just below the resistance of the all-time high and in a very overbought daily swing.
So what will happen next week? The Emini will probably trigger the buy by going above Friday’s high. However, the odds are that the rally will probably stall around this week’s high. The bears will look for a small double top with this week’s high. The neckline is this week’s low and a measured move down is the same 2050 area that the wedge top bears expect to be reached.
The rally has been strong and the bulls have a 40% chance of a strong breakout to a new all-time high and then a measured move up over the next several months. The yearlong trading range is about 300 points tall, so the bulls will try to hold for 2400.
What about a Fed rate hike in February? Beginners learning how to trade the markets need to understand that it is already priced into the market. Do you know of anyone who is unaware of the rate hike? Therefore, the bull dollars and bear dollars are already lined up. No one knows which side is bigger. If there are far more bull dollars, they will get their 300 point rally, and everyone will claim that it is because a rate hike is a sign of a strong economy. If the bears win, everyone will argue that the market was extremely weak and it was being artificially supported by low interest rates. This is all nonsense. The market rallied because it was in search of a price that was too high. If it reverses, it will be because the market decided that it found the price, and now needs to probe down to find a price that is too low. The correct price is never known and changes constantly. Yes, the Fed hike might be the starter’s gun for a sprint, but no one yet knows the direction of the race. It does not matter. If it is up, traders who trade for a living will buy. If it is down, they will sell.
Original post was published at Al Brooks Price Action Trading Blog. Check Brooks Trading Course and get The most comprehensive source of information on price action trading available!


 Review")


