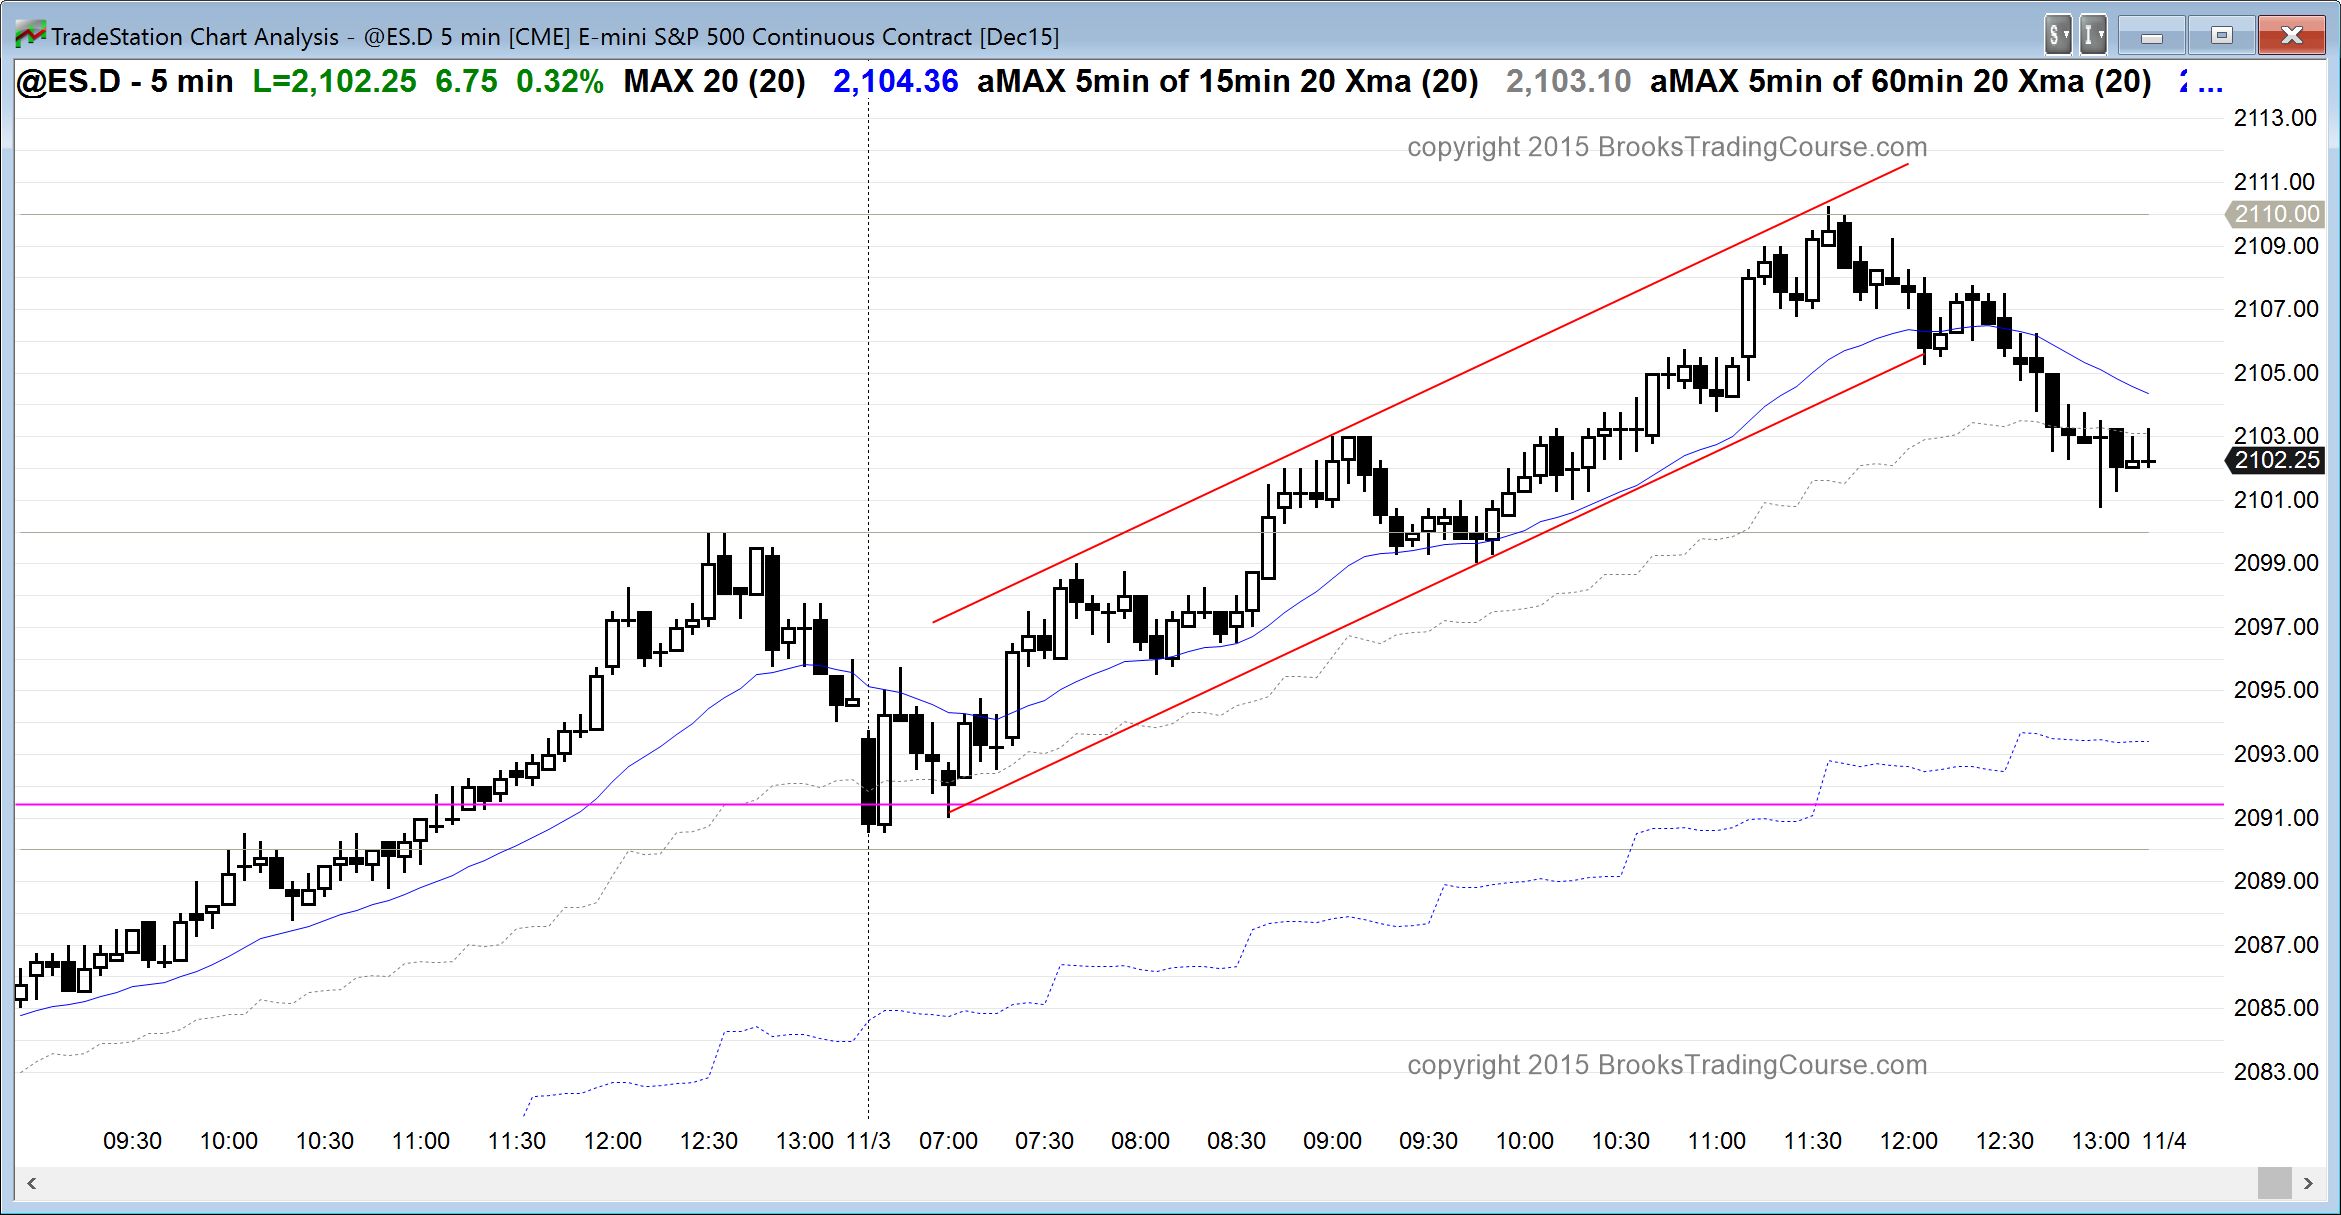
The Emini began with a reversal down and a reversal up in a narrow range at the support of level of the August 17 high (top of the bear trend). This was a Breakout Mode setup, and it often leads to a trading range that lasts 2 or more hours. The target for the bulls is yesterday’s high. The target for the bears is the 60 minute moving average.
When the Emini begins with a Breakout Mode open, bulls look to buy above a good bull buy signal bar near the bottom, or they wait for a strong bull breakout with follow-through, and then buy. Bears look for a good sell signal bar near the top, or they wait for a strong bear breakout with follow-through and then sell.
Because of the buy climaxes on the 5 and 60 minute charts, the upside will probably be limited for the next day or two. Because of the 60 minute wedge top and the consecutive buy climaxes on the daily chart the odds favor a couple of weeks of sideways to down trading. The 60 minute bears might need 1 more test up to form a micro double top before the reversal down begins. Less likely, the bulls will get a strong breakout without the 2 week pullback.
Pre-Open Market Analysis
S&P 500 Emini: Learn how to trade exhaustion
Yesterday broke above the top of the August 17 bear trend. Many traders will conclude that the bear trend has converted into either a trading range or bull trend. Other traders think that the Emini is still is in a bear trend until it gets above the top of the bear swing, which is the all-time high of 2117. It does not matter to most traders. The momentum on the daily chart is up. The weekly chart has had 4 consecutive strong bull trend bars. The odds are that the 1st reversal down will be bought and that the bears will need at least a micro double top before they can reverse the Emini back down. This means that the best the bears can probably get over the next few weeks is a trading range.
The daily and 60 minute charts are overbought. They finally went above an important resistance level. The stops for the bulls are far below. This is a good time for them to take profits and wait about 10 bars before looking to buy again. Ten bars on the daily chart is about 2 weeks. The Emini will probably have at least a couple of legs sideways to down after the exhaustive buy climax.
The 60 minute chart has a wedge top and a Low 4 top (really a Low 5 since the 2nd top is a wedge and it has 3 legs). The odds are that it will correct down to higher lows over the next week or two.
The 5 minute chart had a buy climax yesterday. Traders learning how to trade the markets should know that there is a 75% chance of at least 2 legs and 2 hours of sideways to down trading today. There is a 50% chance of follow-through buying in the 1st 2 hours. If the buyers come in, the pullback can begin after 1 – 2 hours. There is a 25% chance of a strong bull trend day. If it happens, today could reach a new all-time high.
The Globex session traded down all night and is currently down 6 points. That does not alter the odds for the day session. Because of the buy climax on the 5 and 60 minute charts, and on the daily charts, bulls will be more inclined to take profits on rallies and not hold positions for very long. Bears will start selling rallies. Since a trading range on the daily chart is more likely than a bear trend, the bears will also scalp. With traders buying low, selling high, and scalping over the next couple of weeks, a trading range is likely.
Forex: Best trading strategies
The dollar was strong overnight. The EURUSD broke below its 3 day bear flag (small double to pbear flag so Low 2 sell setup). However, the flag did not quite reach the moving average, it is after consecutive sell climaxes, and it is near the bottom of a 6 month trading range. These factors increase the chances that the downside over the next three days will be limited and that the EURUSD will have to go sideways more before deciding between trend resumption down and trend reversal up on the 60 minute chart.
The 60 minute chart is in a bear trend. The bulls want a breakout below the 6 month trading range. The bear want the overnight selloff to reverse up from around last week’s low. If they are successful, those who trade the markets for a living will look to buy a higher low major trend reversal up.
The 5 minute chart last night was in a bear channel. It had a bear breakout below the channel 30 minutes ago. The odds are that there will be at least one more leg down on the 5 minute chart. Because the selloff last night was in a tight bear channel, the best the bulls probably can get over the next couple of hours is a trading range. If they can halt the selling and create a trading range, they then will try to reverse the EURUSD back up. This will take at least a couple of hours.
The bears are hoping that the bear breakout from 30 minutes ago will create a measuring gap and be followed by a measured move down. The height of last night’s bear channel was only 30 pips, and that is the minimum objective for the bears. They will then look to take profits. The result will probably be a trading range. The EURUSD is in a bear trend on the 5 minute chart, but it is oversold and a trading range is likely, but the bear trend might fall another 30 pips first.
Summary of today’s S&P Emini futures price action and what to expect tomorrow
The Emini rallied close to the 2117.00 all-time high, but turned down at the top of a 60 minute parabolic wedge channel. After 6 consecutive buy climaxes on the daily chart over the past month, the upside from here is probably limited. More likely, the Emini will begin to evolve into a trading range for a couple of weeks.
While it is possible that the Emini breaks strongly above the all-time high without pulling back first, it is not as likely as it is that it will pull back. This is extreme buying on the daily and 60 minute charts. The odds are that it will end soon, and it might have ended today. If so, the Emini will begin to test down to the higher lows in the 60 minute bull channel, and transition into a trading range.
Original post was published at Al Brooks Price Action Trading Blog. Check Brooks Trading Course and get The most comprehensive source of information on price action trading available!


 Review")


