The beginning of April has barely begun and has already provided us with a lot of excitement. On Tuesday, during the Asian session, we learned of the RBA’s decision on interest rates in Australia. The Reserve Bank of Australia left rates unchanged at 3.6%. The market took this quite negatively and by today the AUD Australian dollar had lost over 100 pips to the USD. Wednesday morning brought us the decisions of the RBNZ – New Zealand’s central bank. Here, rates were raised by 25bp as expected and the market rather abruptly expressed its satisfaction by raising the NZDUSD by 70p within 5 minutes of the decision announcement.

During the US session, we witnessed increased volatility during the release of the JOLTS data – with the market deeming the data too weak at 9.93m and falling short of the expected 10.4m. The dollar lost heavily against most currencies and precious metals.
What is JOLTS?
The Job Openings and Labor Turnover Survey (JOLTS) is a monthly report from the US Department of Labor’s Bureau of Labour Statistics (BLS) counting job vacancies and layoffs, including the number of workers voluntarily quitting their jobs.
The BLS canvasses more than 20,000 companies and government offices to estimate the number of US job vacancies, hires and layoffs included in the monthly employment report. Layoff numbers are divided into three categories: quits, which are voluntary resignations; layoffs and firings; and other quits, which include deaths and retirements.
The number of vacancies is a commonly tracked indicator of labour demand, while the rate of quits is partly a function of employment demand. Hiring and quits can be used to measure labour turnover.
7 April – payrolls
This Friday payrolls – the US labour market report. 240k of new non-farm jobs are expected. It is certainly worth being prepared for more volatility on the dollar pairs following the publication of this important data for the Fed – especially when determining monetary policy. Usually, as important data approaches, I try to avoid instruments influenced by them. Trading on a cross, i.e. a pair directly independent of the dollar, can be a good solution.
Head and shoulders on AUDCAD – neckline under fire.
For quite some time now, on the AUDCAD pair, the market has been moving towards and away from the neckline of the large H&S formed for over the last 4 months.

H&S formations are usually trend reversal formations. Theoretically, the dips in this case could be at the height of the formation, i.e. around 500p. I would not go that far, but for a start the price is likely to head towards the support level of 0.8960. The eventual overcoming of the support could accelerate declines and then the next target is the minimum level from last November – 0.8860 . It is also possible to test the defeated neckline from below before the declines.
LIVE EDUCATION SESSIONS
This WEEK (3-7 APRIL) I am pleased to invite you to several online sessions. Below is the schedule of meetings:
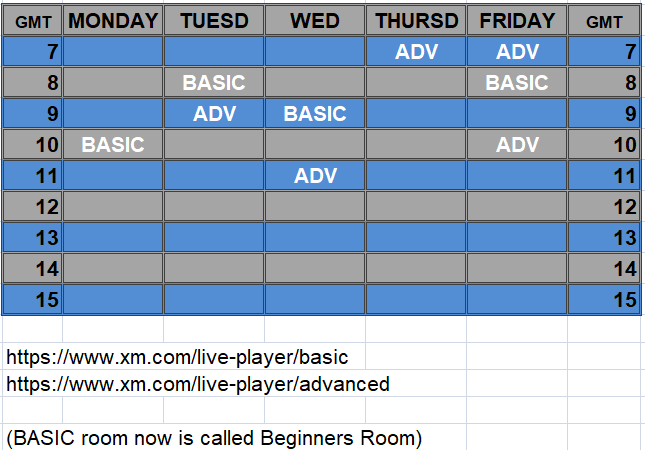
Links: BASIC (beginners room) ADVANCED ROOM
The above analysis is based on the PA+MACD strategy, a detailed description of which you can read HERE . I will talk more about the PA+MACD strategy applied to these currency pairs during the live trading sessions which you can attend from Monday to Friday.
More current analysis on the group : Trade with Dargo
 In our Facebook group, which you can join anytime: https://www.facebook.com/groups/328412937935363/ you will find 5 simple strategies on which my trading is based. There, every day we post fresh analyses of currency pairs and commodities. You can also visit my channel where I post my trading ideas: https://t.me/TradewithDargo


 Review")


