Last week fifth bullish candle in a row appeared on DAX. It had higher high and low than previous one, what is the simplest confirmation of continuation of bullish trend. Unfortunately if we look at correlated with DAX S&P500 German bulls can feel a little unfulfilled. Last Wednesday FOMC decided to leave rates unchanged, and the conference was quite dovish. It caused huge appreciation of US stocks in weakening of dollar.
In this week the most news will be published on Tuesday when we’ll know PMI readings. And on Friday all important stocks will have free day.
IF YOU ARE INTERESTED IN INVESTING ON INDICES LIKE DAX30, TRY FREE FXGROW ACCOUNT
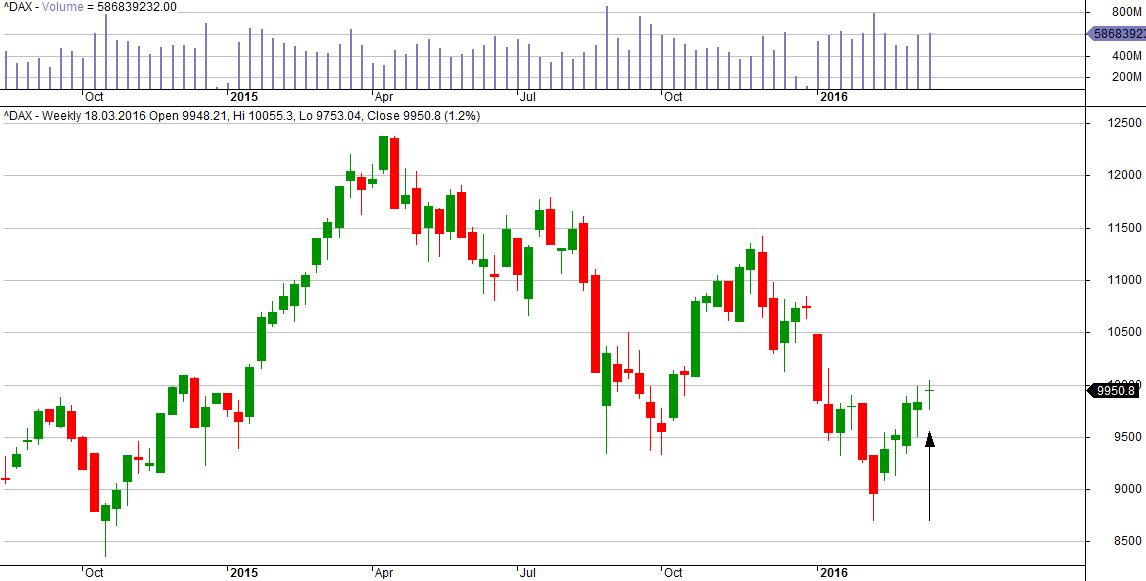
DAX weekly: Last candle on DA W1 chart is a doji star. It is often signalizing trend reversal, in this case it predicts decreases. If negative scenario want to be fulfilled, bears should attack in the beginning of new week and break closest support at 9,910 pts. Doji star should be interpreted as balance candle between bulls and bears and in this case it can be a warning, but it doesn’t mean that negative scenario will happen.
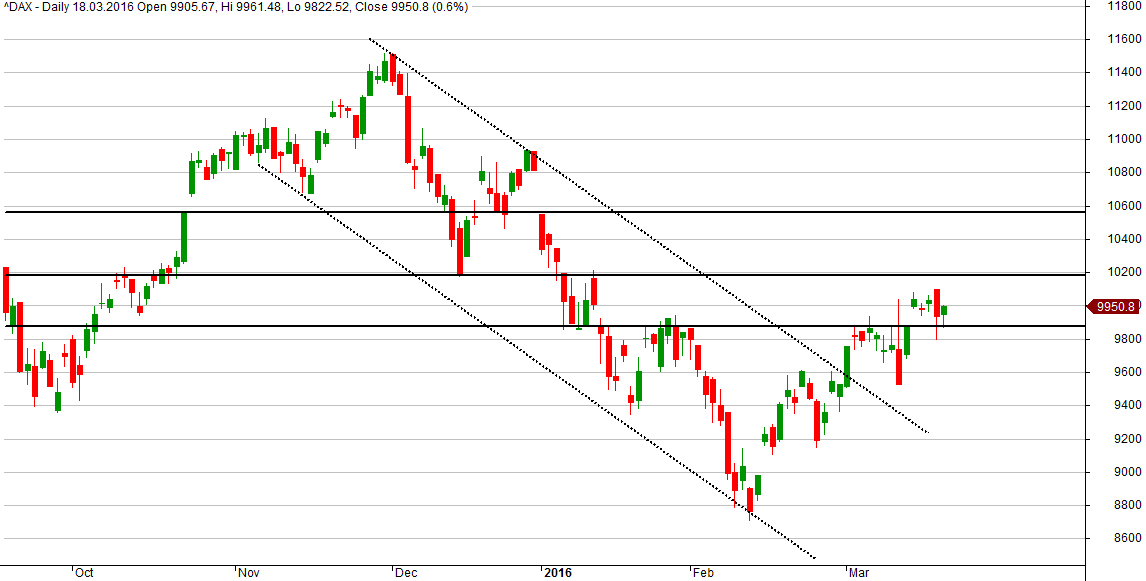
DAX Daily: Last week bulls managed to break 9,910 pts resistance and this level will become support now, on Thursday and Friday it was defending against decreases. Unfortunately bulls on DAX didn’t have as good score as correlated US stocks. German bulls had problem with EURUSD strengthening.
On Friday there was end of March futures so you can see very big volume on stocks. If bears will dominate in this week, the closest supports are at 9,910 pts and 9,500-9,400 pts area. If bulls will be stronger the closest resistance is at 10,000 pts and next strong one is at 10,180 pts.
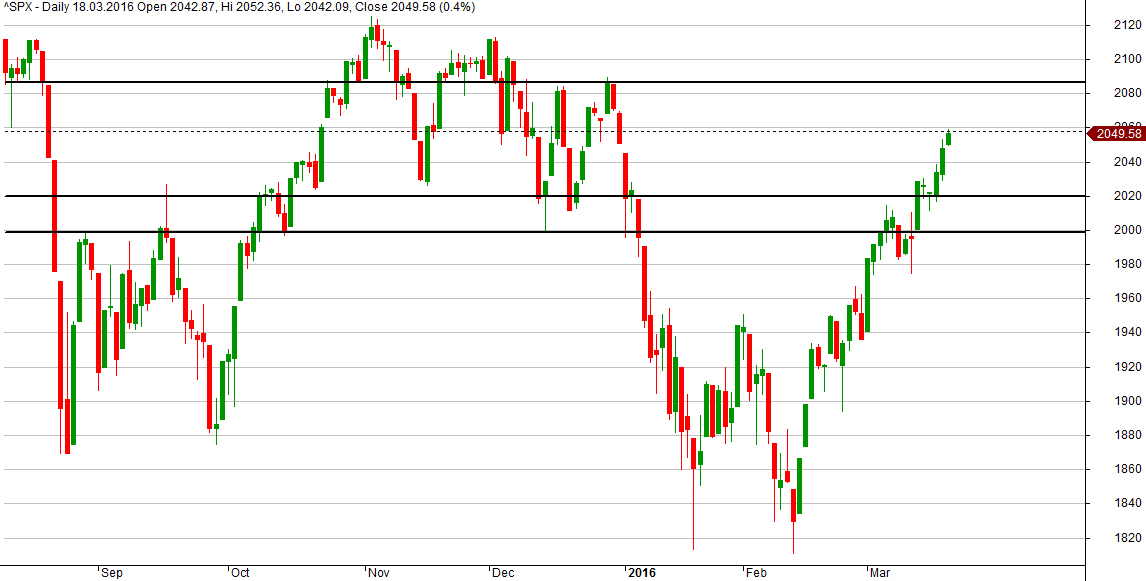
S&P500 Daily: Situation is quite different over here – 2,000-2,020 pts area was broken and bullish move is continued. Index reached to weak resistance at 2,050 pts and another one is at 2,080 pts. If there would be any rebound right now, 2,000-2,020 pts area will create support zone.
Central banks all over the world continue low rates policy and after last FED conference it looks like US do not want to be only hawks in the nests of doves.


 Review")


