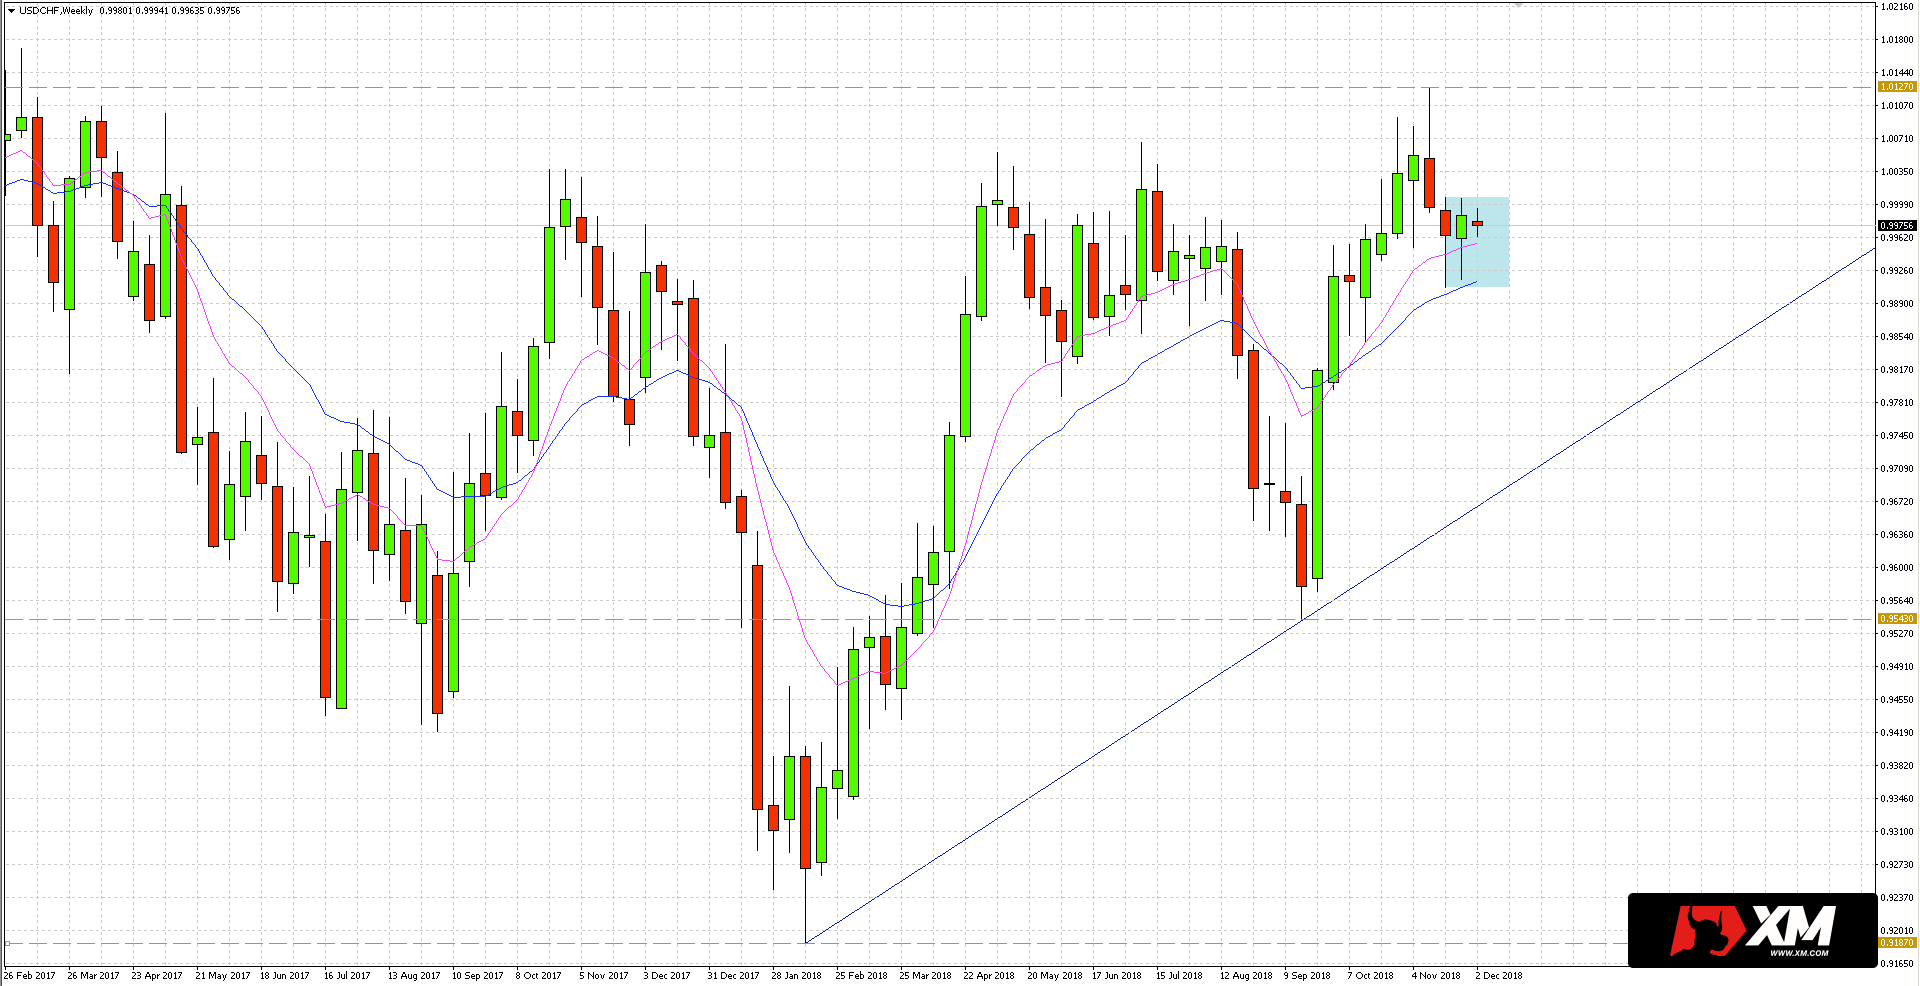
The dollar (USD) in relation to the Swiss franc (CHF) last week was traded in the range of last week of November. This kind of behavior of the price led to the creation of a inside bar on a weekly chart.The location of the above-mentioned formation is important. As you can see in the chart below, the shadows of the last two candles (inside the bar) are testing the dynamic support provided by the average EMA 10/20 channel. An effective breakout from the IB can give tips on the further direction of the USD/CHF pair. In the case of closing the week above the maxima of the mother’s candle, there will be a chance to continue the upward movement preceding the correction. Then the nearest goal will be the high at 1.0127. Alternatively, breaking down would also involve overcoming dynamic support and negating the pro-growth shadows of the last candles. Thus, the sellers would pave the way for the trend line running from this year’s lows.


 before the chance to increase. Outside bar on support.")


