The passing week, popularly known as the “long weekend”, did not abound in important events in the country by the Vistula River because of the additional two days off from work. But abroad, the world of finance was not idle (except maybe Japan, which celebrates 10 days in a row). Three main events of this week – Wednesday’s FED meeting, Thursday’s Bank of England and Friday’s payrols ensured that increased volatility appeared on the markets. Let’s take a look at how the analysis from Monday’s USDJPY and Tuesday’s USDCHF pairs worked out.
USDJPY – 28.04-04.05.2019
In the analysis: “The USDJPY – Inside Bar and divergence are signalling declines” I wrote:
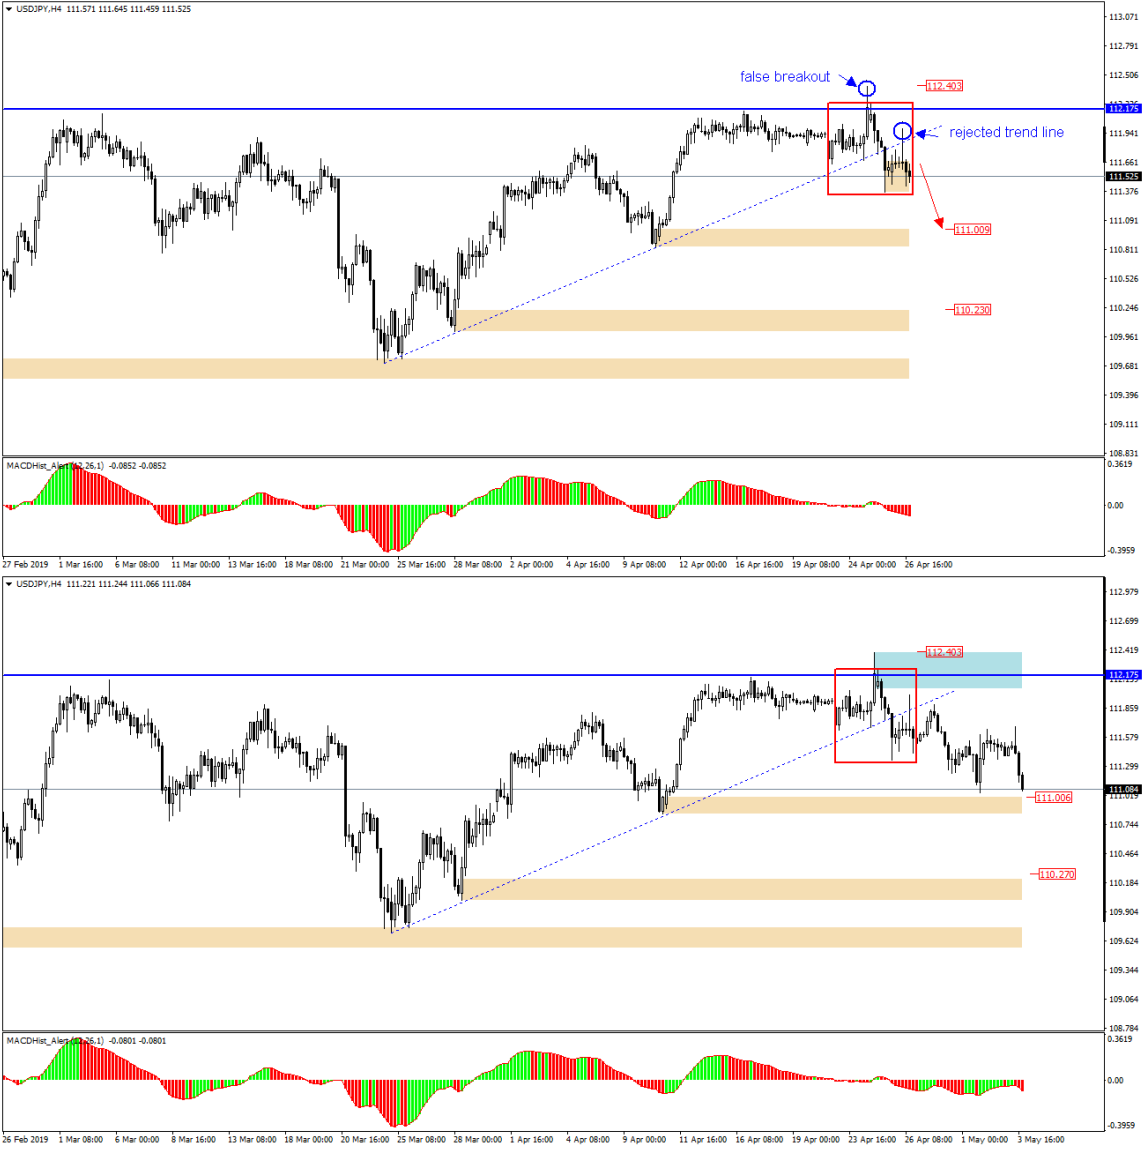
“If you look at H4 chart, you will notice that:
– after reaching the this year’s maximum, quotations went backwards indicating a rejection of 112.17
– On Friday, a candle with upper long wick appeared which indicates a successful re-test of the defeated local upward trend line. Taking into account the ongoing downward divergence on the MACD in the daily chart, we can expect to see decreases towards the nearest demand zone at 111.00 with a high probability…”
The attached charts confirm that the analysis was correct… even twice ;), because after Friday’s payrolls the price again reached the demand zone indicated in the analysis 111.00. Another pin bar appeared, which may indicate that this is not the end of falls on this pair.
USDCHF 30.04-04.05.2019

In Tuesday’s analysis I focused mainly on Inside Bar and Bearish engulfing, which indicated decreases. I wrote this way: – “daily candle from 23.04 created Inside Bar formation, because for the next two days the quotations were not able to overcome its extremes. Although the 26.04 quotations surpassed the upper IB limit, setting the maximum for this year, at the end of the day price returned to the inside of the formation, pointing to the so-called false breakout, creating an additional pattern – bearish engulfing. In the chart H4 below we can see that the price is still within the IB range, but the bearish divergence in the MACD increases the probability of breaking out thru the IB bottom and the target for supply may be the nearest support starting at the level of 1.0124.”
Only 24 hours after writing these words, the scenario was realized with precision to the nearest pip, after which there was a pressure of demand and the price returned to IB. After Friday’s publication of data from the US labour market, the pair returned to declines. On the basis of these analyses I have collected over 200p this week:


 Review")


