Today I have turned my attention to the EURNZD pair – a pair of currencies coming from the opposite ends of the globe. The economic exchange between the European Union and New Zealand, if only because of the distance between these regions, represents a small percentage of their trade with other countries. Is it possible to predict the direction of this pair?
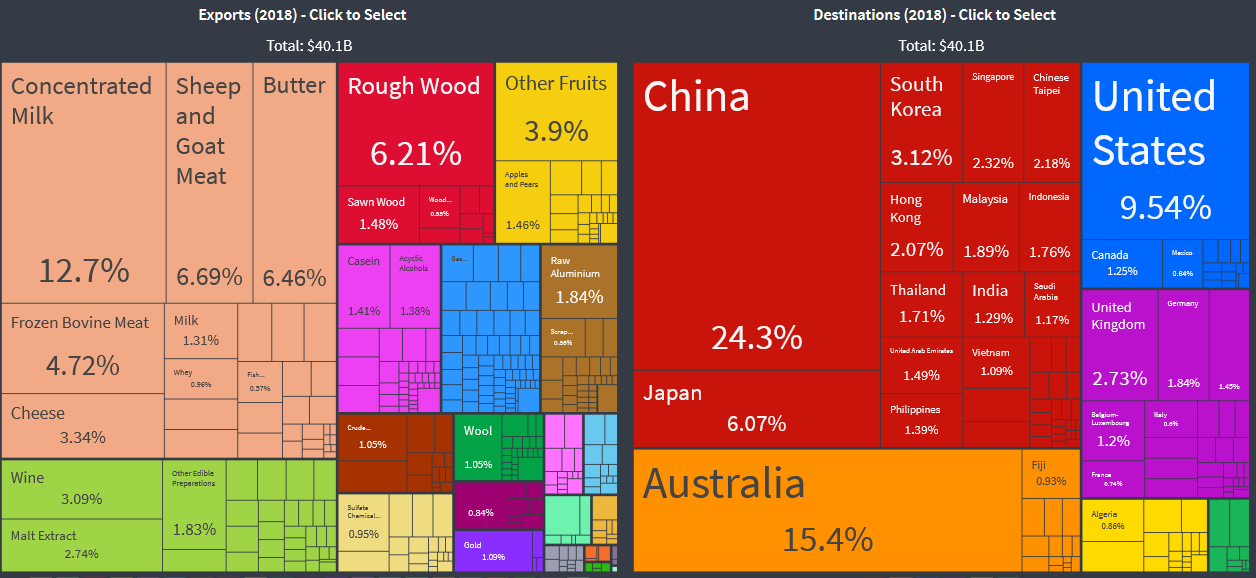
On the basis of 2018 data, we can assume that export-import between the 27 countries of the EU and the NZ accounted for about 9% of all trade of New Zealand, which does not look impressive in comparison with the exchange with China (25%) or Australia (15%).
The NZD currency (the New Zealand dollar, often referred to as “kiwi”) is classified as a raw material currency, i.e. dependent on the prices of raw materials which are the basis for their turnover in exports. In the case of NZD, the attached picture shows that the basic export raw materials are milk concentrates, meat, butter, lumber and fruit.
Kiwi dependent on milk powder?
It is worth remembering this when analysing the New Zealand dollar – that it is not the prices of oil or iron ore that influence the condition of the NZ economy, but above all animal and agricultural products. That is why it is worthwhile to observe the milk product exchanges – because the prices set there may have a huge impact on the NZ currency.
The fact is that “Fonterra Co-operative Group Ltd. an international dairy cooperative owned by some 10,500 New Zealand farmers is the largest company in New Zealand… The company is responsible for around 30% of world dairy exports and has revenues in excess of 17.2 billion NZ.
So let’s take a look at this “milky” currency and how the quotations in relation to the Euro can be expected in the near future.

In the daily chart we can see that after reaching 1.9925 during the period of the biggest drops on the world exchanges, the pair started to make up for losses to the EUR and is currently above the strong level (S/R) = 1.7160.
The daily candle of 07.07 along with the next one formed an inside bar formation. The attempt to overcome mentioned S/R level on Friday was unsuccessful, today the market is approaching the upper edge of the inside bar formation.
If the top break proves to be successful and at the same time the MACD oscillator starts to grow (it will turn green), it may be a signal that the correction of the last drops on this pair is coming.
You can also visit my channel where I post trading ideas: https://t.me/TradewithDargo
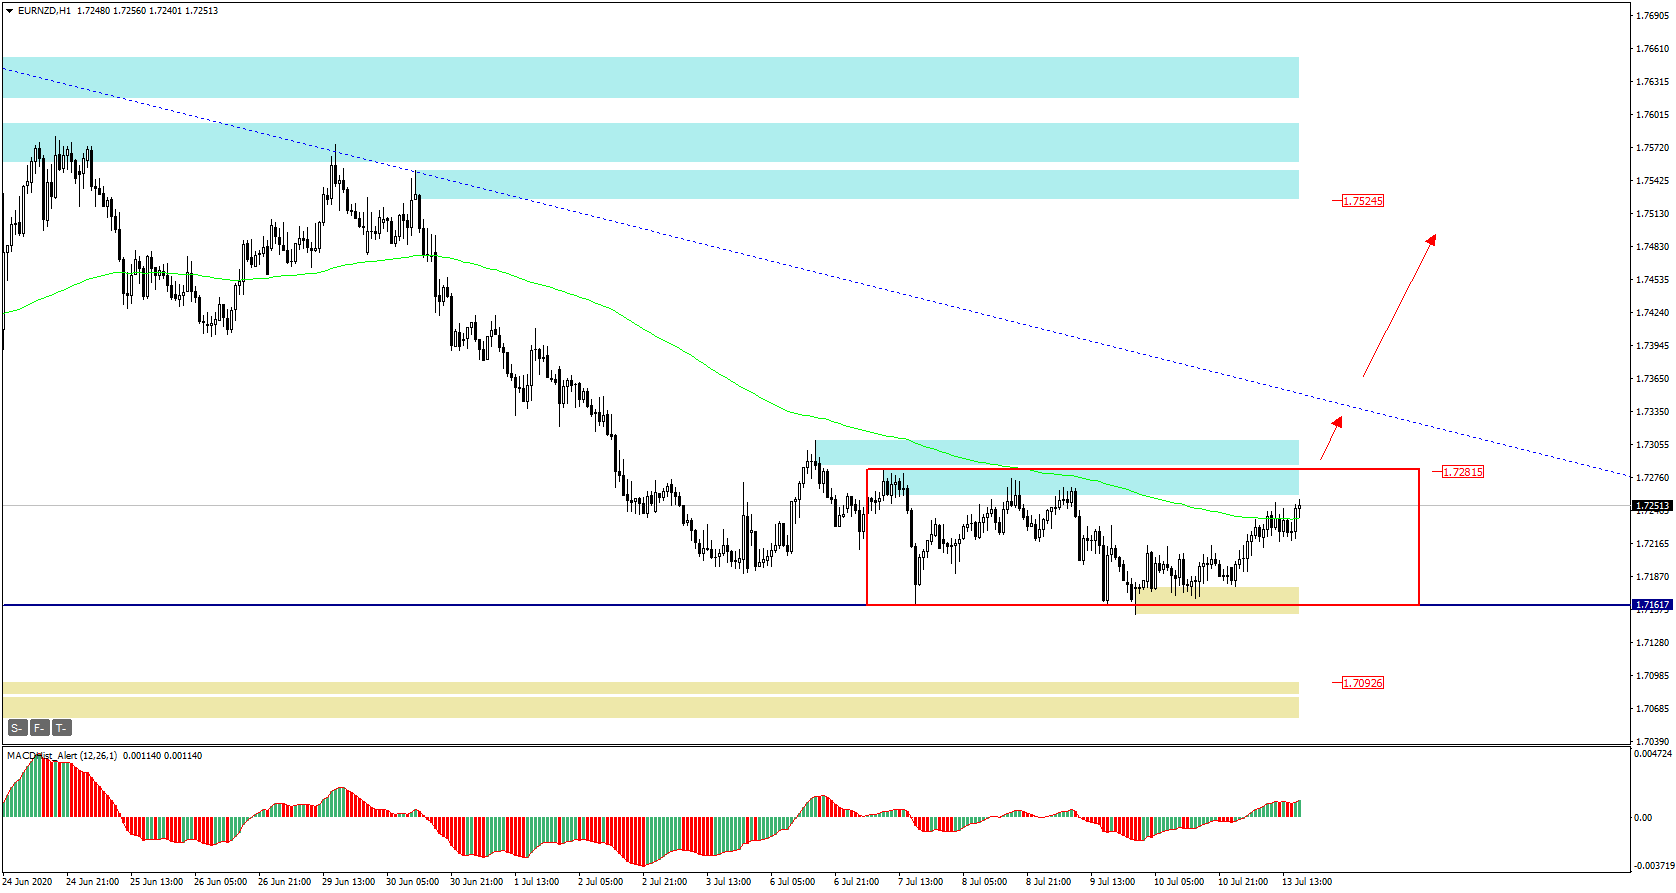
On the H1 chart we can predefine the range of possible increases. After an effective topping out of the inside bar (red rectangle) the demand target may be a downward trend line (dashed blue) and then a supply zone 1.7520.
A breakout of 1.7160 may negate the uptrend scenario and be a signal for further declines to demand zone 1.6835.
 In our Facebook group, which you can join anytime: https://www.facebook.com/groups/328412937935363/ you will find 5 simple strategies on which my trading is based. There, every day we post fresh analyses of currency pairs and commodities. You can also visit my channel where we can post our trading ideas: https://t.me/TradewithDargo


 Review")


