GBPAUD is one of the more “aggressive” crosses, similar to GBPJPY, where daily range often exceeds 200p, and even 300p daily candles are also not so uncommon. In times when the maximum leverage for European brokers is 30:1, this daily volatility is particularly attractive.
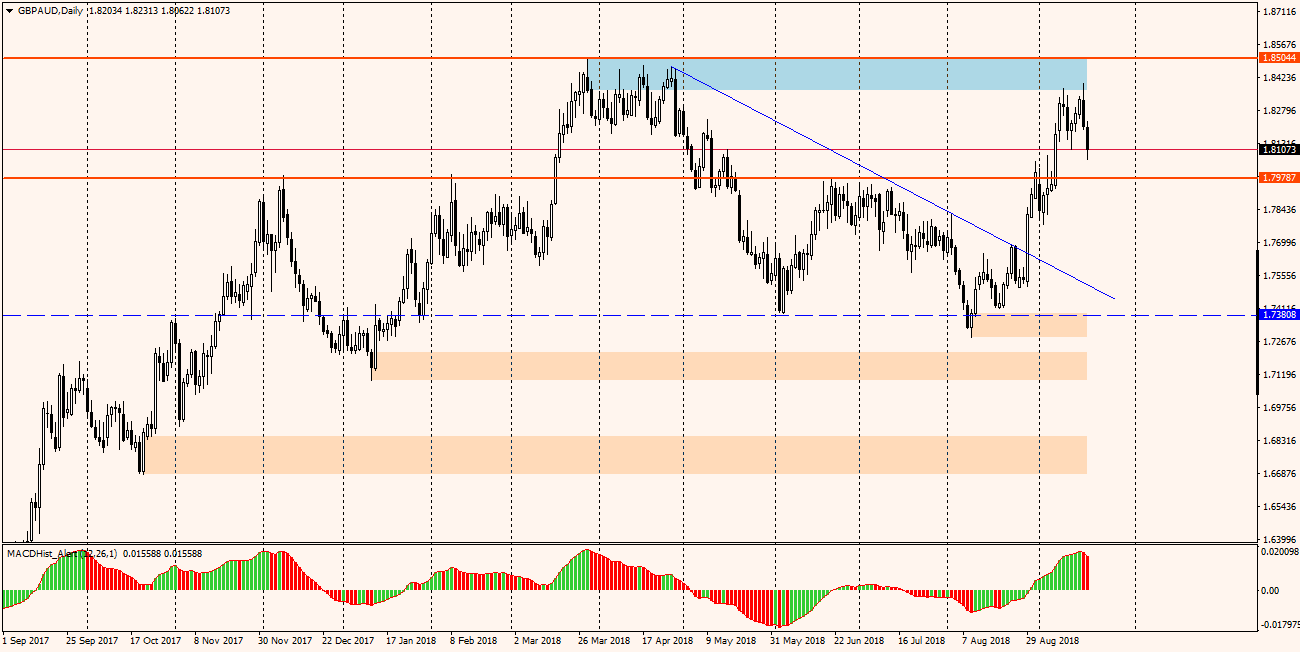
The pair established its minimum this year (1.7090) in January and in a short time because already in March it set this year’s maximum (1,8504), which resulted in an increase of nearly 1,400p. Since then, the pair has been moving in a broad consolidation between the said maximum and the 1.7380 level. We are currently observing declines towards the lower border of mentioned consolidation. On the daily chart, the MACD oscillator created a maximum this week and starts to fall, which suggests further declines.
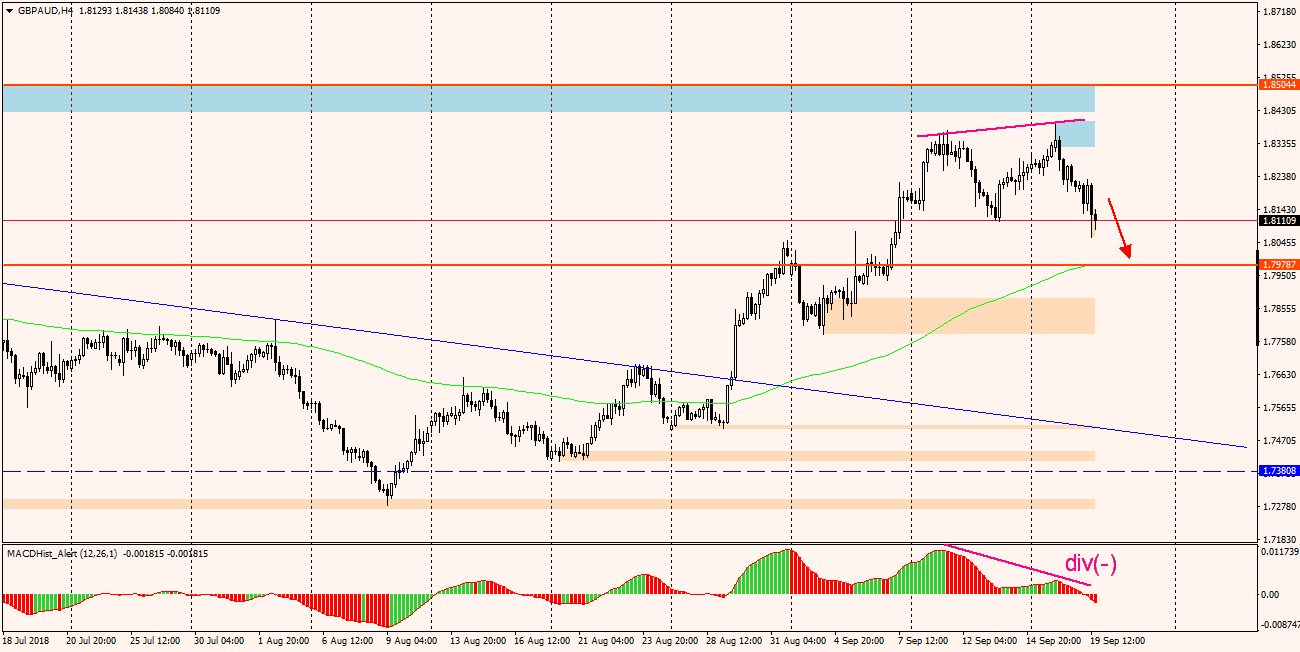
We have a bearish divergence in progress on H4 (chart below), which supports the downward scenario. The closest goal for bears can be support at the level of 1.7980, which at the current rate of 1,8100 would give about 100p.
The analysis is based on the PA+MACD strategy.


 Review")


