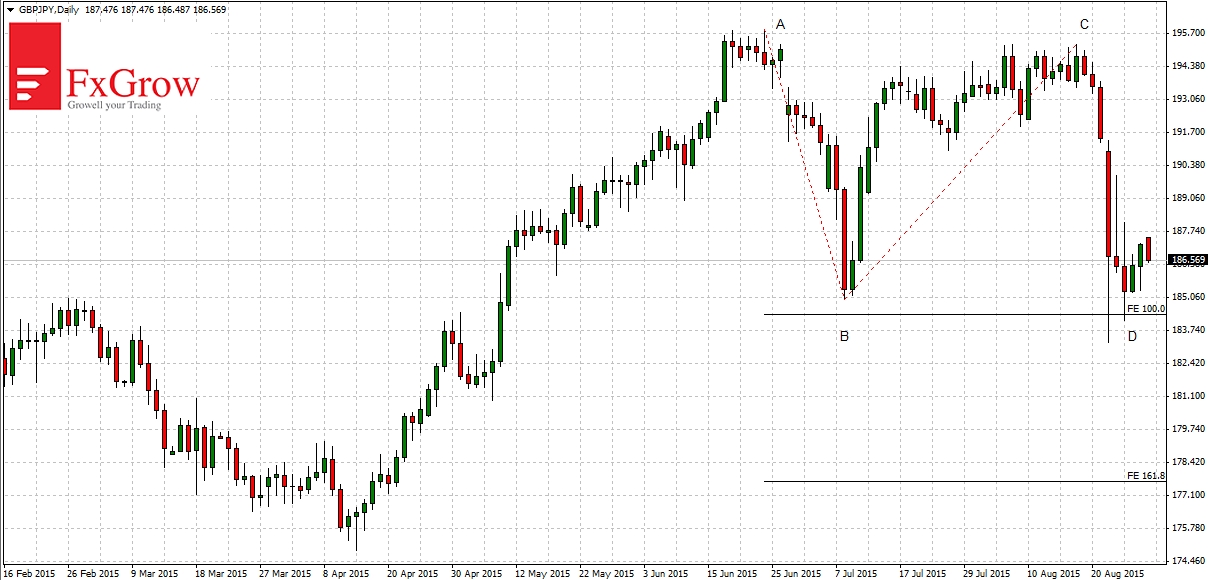
In a longterm on GBPJPY there is an upward trend, and last drop that started in June closer to the end. Length CD last move downward (which began on 18 August from 195.26) is equal length AB (visible on the daily chart). If last week’s bottom wouldn’t be break in the coming days, we may see a new move upward. Alternatively break this level could bring price to 177.80 or 161.8% fibo AB.
H1 Time-frame
At the H1 interval upward channel formed, in which the price moves for four days. After the last drop, the channel looks like a flag. It prefer a scenario that I described above as an alternative. Descent to the level of 177.80, and return to growth.


 Review")


