GBPJPY – Since the end of February this year, the pair has been moving in a less and less extensive consolidation, drawing a triangular pattern on the chart. The first attempt to exit the formation took place on May 3, but one day later the quotes turned back to the triangle indicating that it was a “false” breakout and finally on May 8th the price dynamically left the triangle down.
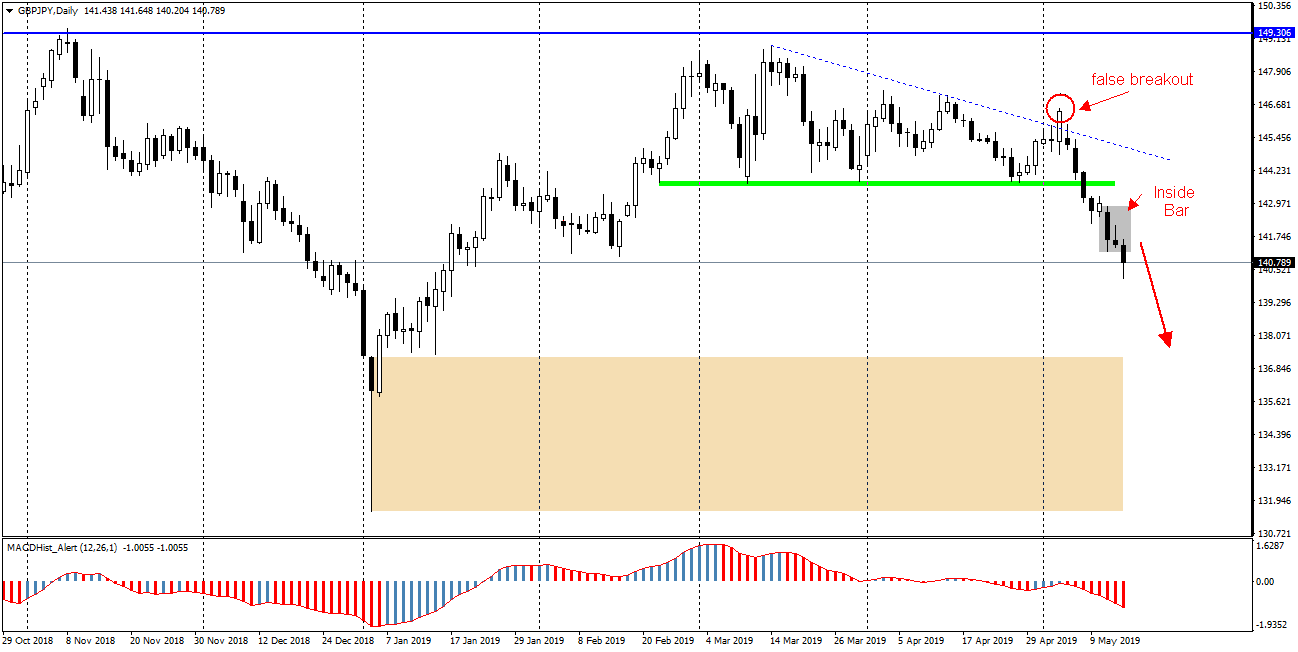
Monday and Tuesday daily candles formed the Inside Bar pattern from which the bottom was broken today.
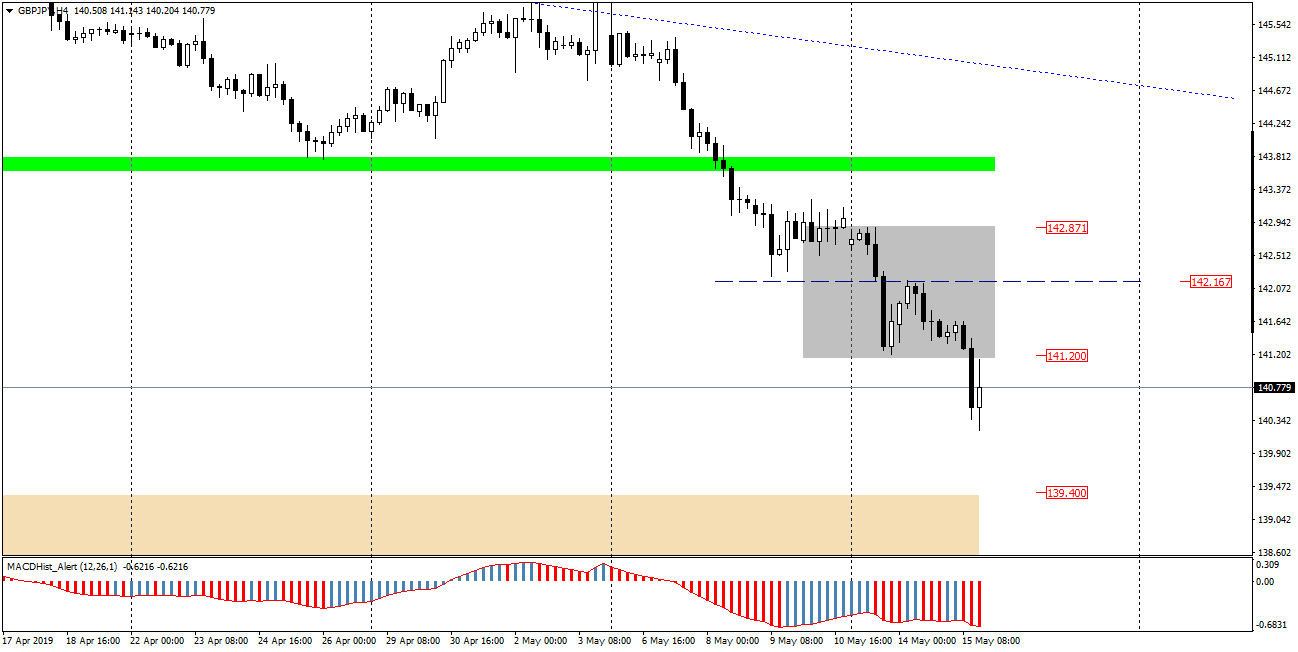
When you look at chart H4, you will notice that after the breakout of the IB the price went back to the defeated bottom limit (141.20) of the Inside Bar and after the re-testing, it moves down again. In this situation, we may consider opening Sell order with TP in the vicinity of the nearest demand zone 139.40 and Stop Loss above 141.20. It is also worth noting the level of 142.16, which is in the middle of the IB – overcoming it will negate any drops and start an upward scenario.


 Review")


