On Friday I analysed the situation on this pair’s chart, but I think it’s still worth focusing my attention on this instrument, which is attractive because of its high volatility and the chance to hunt down a large number of pips. Recently we have been dealing with double formations quite often, i.e. Outside Bars are formed in Inside Bar and vice versa.
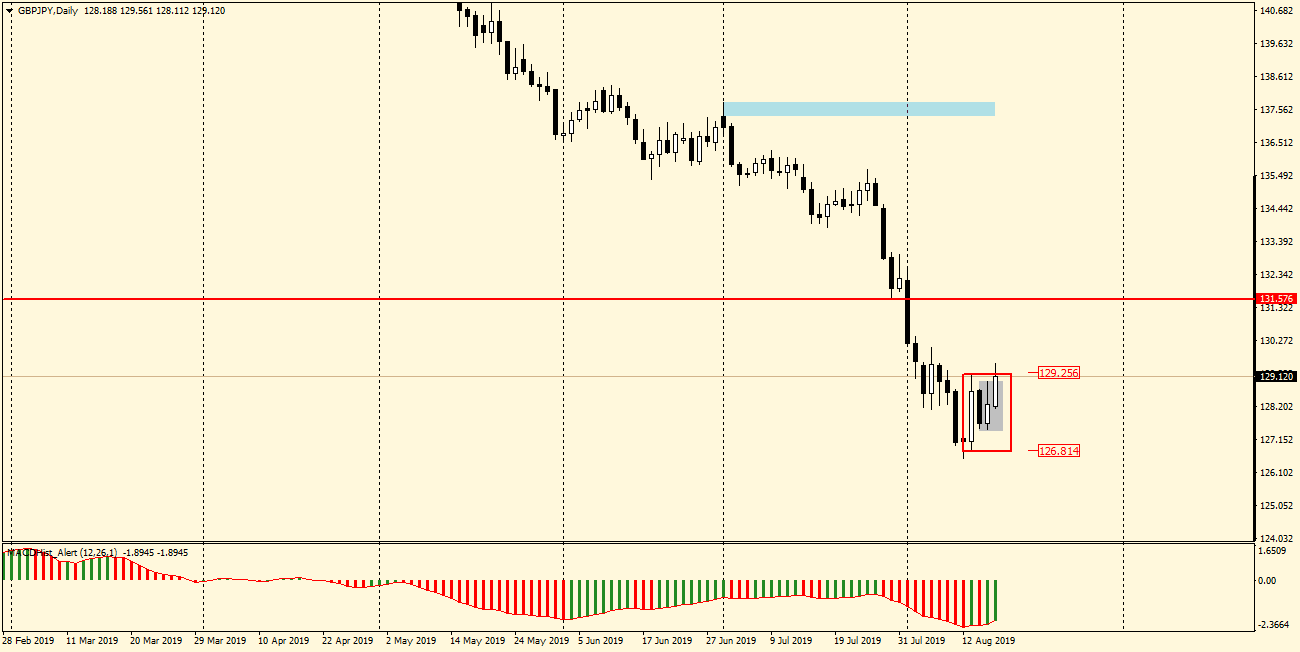
On the daily chart (above), the IB pattern is marked with a red rectangle and the OB is marked grey. The price at the end of Friday’s session went back to IB, but remains above OB. This is shown in more detailed in the H4 chart below, which clearly shows that the upper OB limit supported the last 2 four-hour candles.
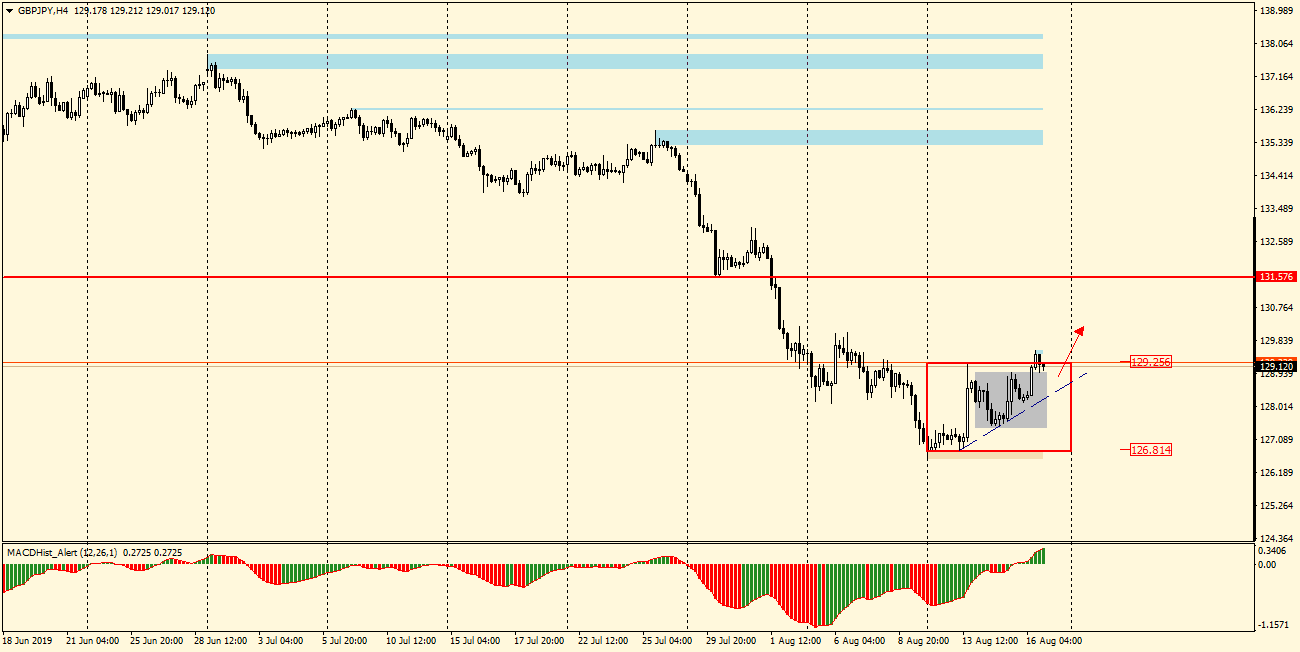
Looking at MACD, both on D1 and H4 interval sentiment is bullish. Further increases can be expected after the successful price breakout from the IB, however, overcoming the local trend line (intermittent blue) may indicate a return to declines.
 In our Facebook group, which you can join anytime: https://www.facebook.com/groups/328412937935363/ you will find 5 simple strategies on which my trading is based. There, every day we post fresh analyses of currency pairs and commodities


 Review")


