I must admit that after reviewing the charts of a dozen or so pairs this weekend, it was difficult to point out where the situation clearly would give grounds to indicate the direction the chart will follow in the new week. In my analysis, I stick to three strategies based on Price Action, and only GBPUSD seemed to me interesting in this respect.
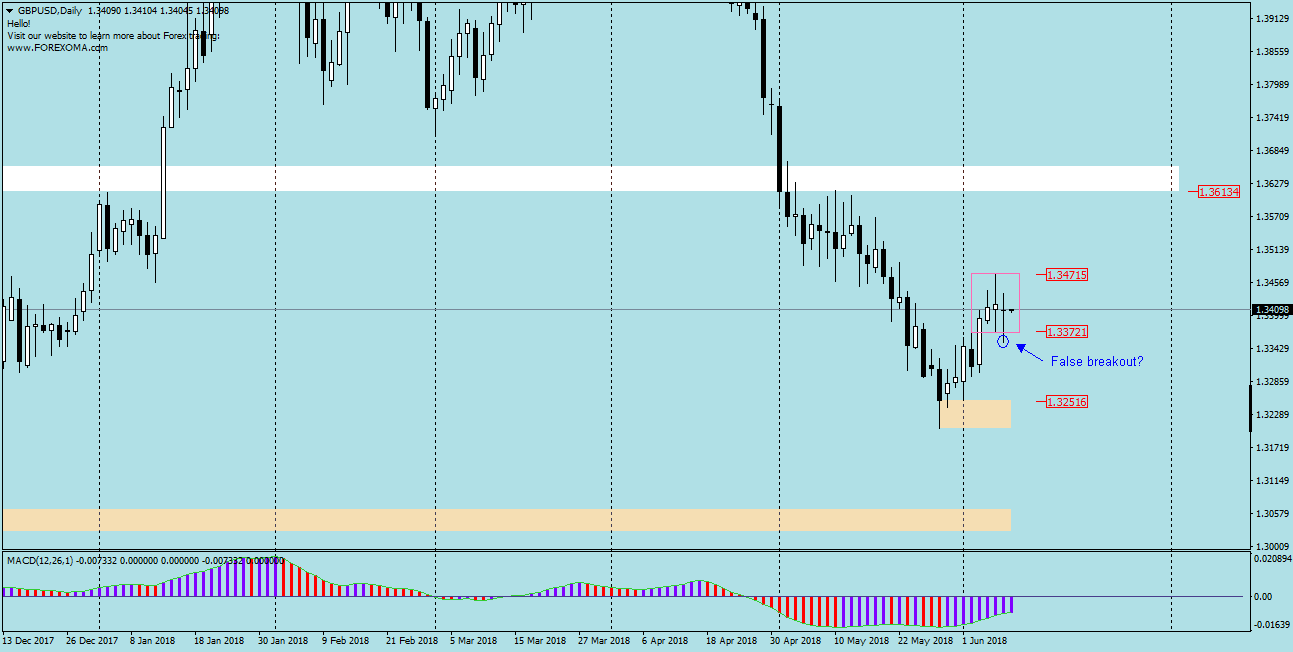
On the Daily chart was created an Outside Bar with the range of 1.3471-1,3372, which is usually a bullish formation when the “mother candle is bullish. Next daily candle penetrated the lower range of OB, but the quotes returned to its range, and its lower shadow suggests a “false” breakout. As usually in such formations, effective breaking out from OB or Inside Bar gives an impulse for dynamic movement.
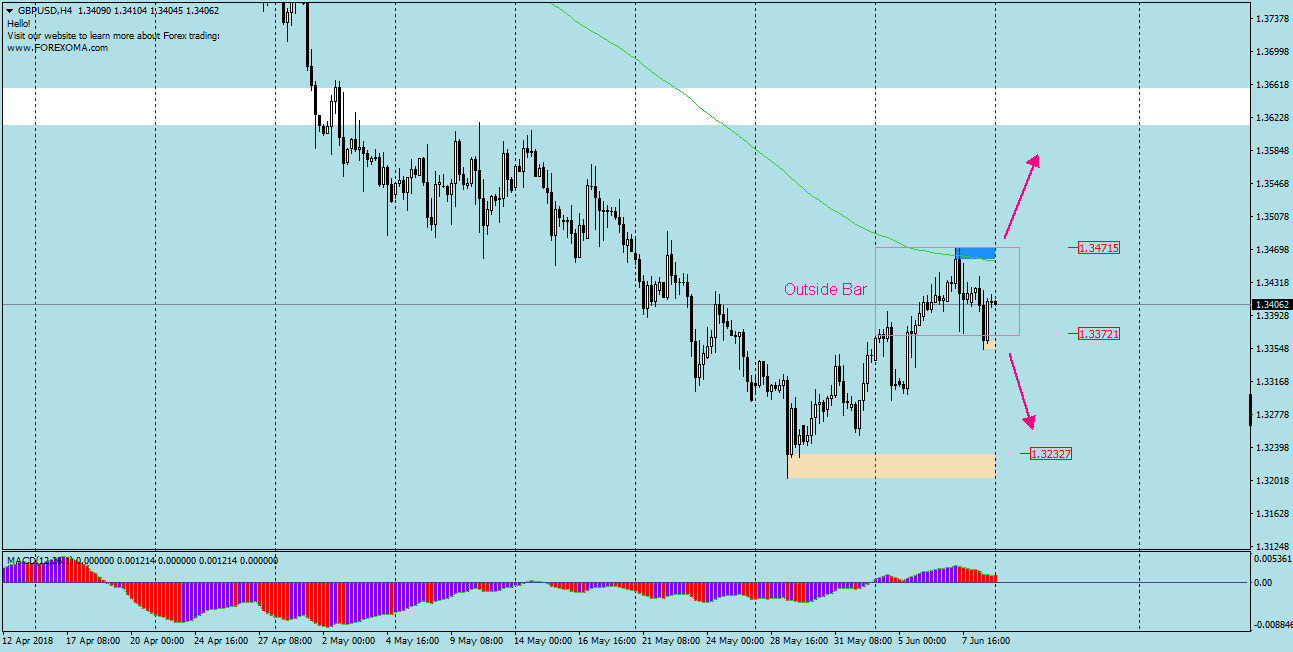
Therefore, it is worth observing this pair and in the case of a confirmed direction of the exit from OB submit an order for:
– Buy when the breakout occurs by the top
– Sell (less likely due to the aforementioned “fake”) when again breaks the bottom of OB.
The range of the motion can in any case be around 110p
The next level of support is 1,3250 and the resistance is 1,3600


 Review")


