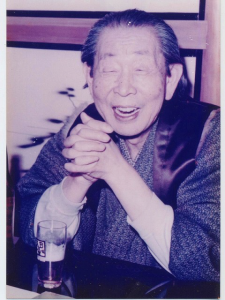
Ichimoku Kinko Hyo (or just Ichimoku) is an investment strategy developed by a Japanese journalist Goichi Hosoda. The strategy name came from Hosoda pseudonym – he was signing hist articles and works as Ichimoku (which means “one look”) Sanjin. Hosoda developed this strategy before World War II and for more than thirty years worked on perfecting it. Hosoda published his work in 1969 and described the rules of Ichimoku strategy. It should be a “one look” system – using Ichimoku indicators investor know after just few seconds what to do with financial instrument, currency, commodity or other assets class. Below, one of the few pictures of Hosoda available to the general public:

Ichimoku is an investment strategy (trend-following one) – it allows us to conclude with high probability that we are in a trend (not in consolidation), to determine the exact market entry point and few ways to close the position. Certainly, it is not a strategy that captures price highs and lows on the chart – it is a strategy that does not forgive even a single pip. But in return, Ichimoku allows you to earn in longer term, giving time to apply good capital management strategy. It is also relatively stress free, without poring all day in front of the PC screen.
Such described strategy may sounds like a Holy Grail – but it is not. There are false signals, the price always can return suddenly and go in the opposite direction. This is a strategy designed for real trading, which takes into account all possibilities. But the most important is that Ichimoku – which I have the pleasure to present you – give you profit opportunities in the long run.
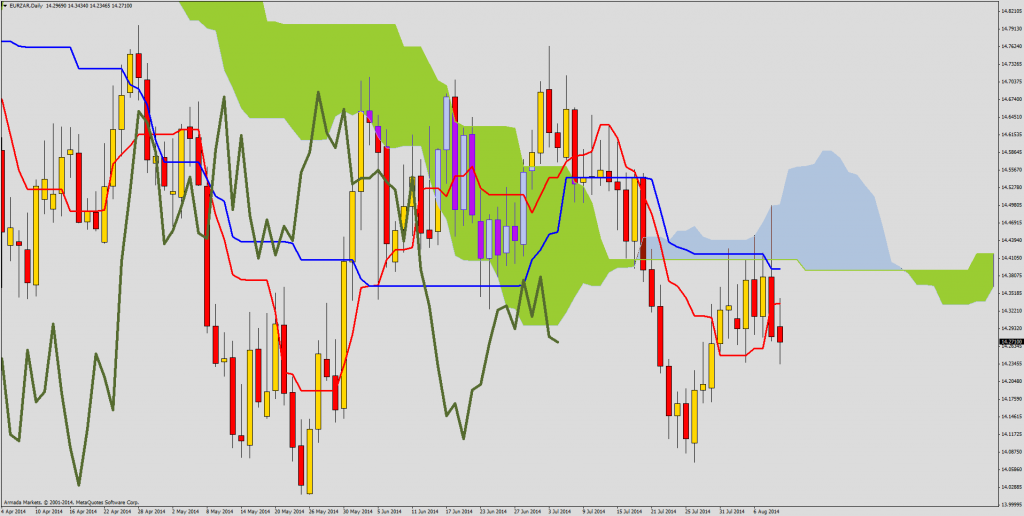
Ichimoku is very popular among Japanese traders – and although it makes a great job on all of the currency pairs, you should mainly focus on pairs like GBP/JPY, EUR/JPY and USD/JPY using original settings. For these pair there is the biggest likelihood that their levels will be respected by price. On the Ichimoku chart you can find lines and indicators like:
- Tenkan Sen – red line
- Kijun sen – blue line
- Senkou Span A – upward cloud (blue one) upper limit, lower limit of the downward cloud (green one)
- Senkou Span B – downward cloud (green one) lower limit, upper limit of the upward cloud (blue one)
- Chikou Span – green line
Tenkan Sen Average, which we receive by adding the highest high and lowest low achieved by the price during the period and divided by two. Formula: (HH+LL)/2 for the last 9 periods
Kijun Sen Another average line, which we get from formula: (HH+LL)/2 for the last 26 periods. Highest high and lowest low achieved by the price in the last 26 periods.
Chikou Span It is a lagging line shifted back by 26 periods and is used to confirm the direction of the trend.
Senkou Span A Average that is a mix of Tenkan Sen and Kijun Sen divided by 2. The result of such formula is placed about 26 periods forward on the chart (Tenkan Sen + Kijun Se)/2. This is another specificity of Ichimoku – average that is shifted 26 periods further and observation how he price will behave relative to this line in the future.
Senkou Span B We get this line by adding highest highs and lowest lows from 52 last periods (candles), diving it by 2 and putting the result 26 periods to the front. (HH+LL)/2
Kumo Or Cloud, is a zone between Senkou Span A and Senkou Span B. When price is inside the Kumo we now that currency pair is in consolidation and we should wait with trading decisions.

Ichimoku in Practice
First of all, you have to check D1 chart and do not play against the trend on this TF (sometimes there may be exceptions – e.g. when price is inside the cloud).
Signals from H4 – the most important signal is cloud breakout, especially in the trend direction – so in upward trend price should break the increasing Kumo and in the downward trend the decreasing one. The next signal is generated by Kijun Sen line rebounds. Price breaks that line, but returns to form the candle which indicates the continuation of the main trend.
Position management: Keep watching that there is no signs of a trend reversal: closing over/under Kijun sen line (in opposite to trend), closing the candle inside Kumo or responding to resistance/support zone. If yes, then you should shorten your position.,
Closing the position: TPs on important monthly or weekly supports/resistance, closing parts of the position on daily supports/resistances or closing totally when opposite signal occurs.
Our analysts team will present you regularly trading setups prepared thanks to Ichimoku Kinko Hyo strategy. Showing positions we will usually wroth why we have opened them, how we want to manager them and where we see our potential targets.
At the first sight Ichimoku may look complicated – but after few hours it really becomes a “one look” system!


