Looking at the quotations of the NZD/CHF currency pair, we can see that the market has been moving north since the second half of September 2019. These increases reached the level of 0.6920 already at the beginning of December last year, which, despite numerous subsequent tests, remained unbeatable.
Analyzing the technical situation so far, one can see a formation of an ascending rectangular triangle, whose upper limit was the above-mentioned resistance and the lower limit was the line of an ascending tendency.
It is also worth noting that since mid-February this year, consolidation has also been established within this formation, the lower limit of which was support in the region of 0.6790.
As a result of last week’s monetary decision, and not so much the decision itself, as a more profound change in the rhetoric of the RBNZ, assuming that if in the future there would be a change in the height of the interest rates, there is a greater chance for cutting them than increasing, a significant sell-off of the New Zealand dollar was noticeable.
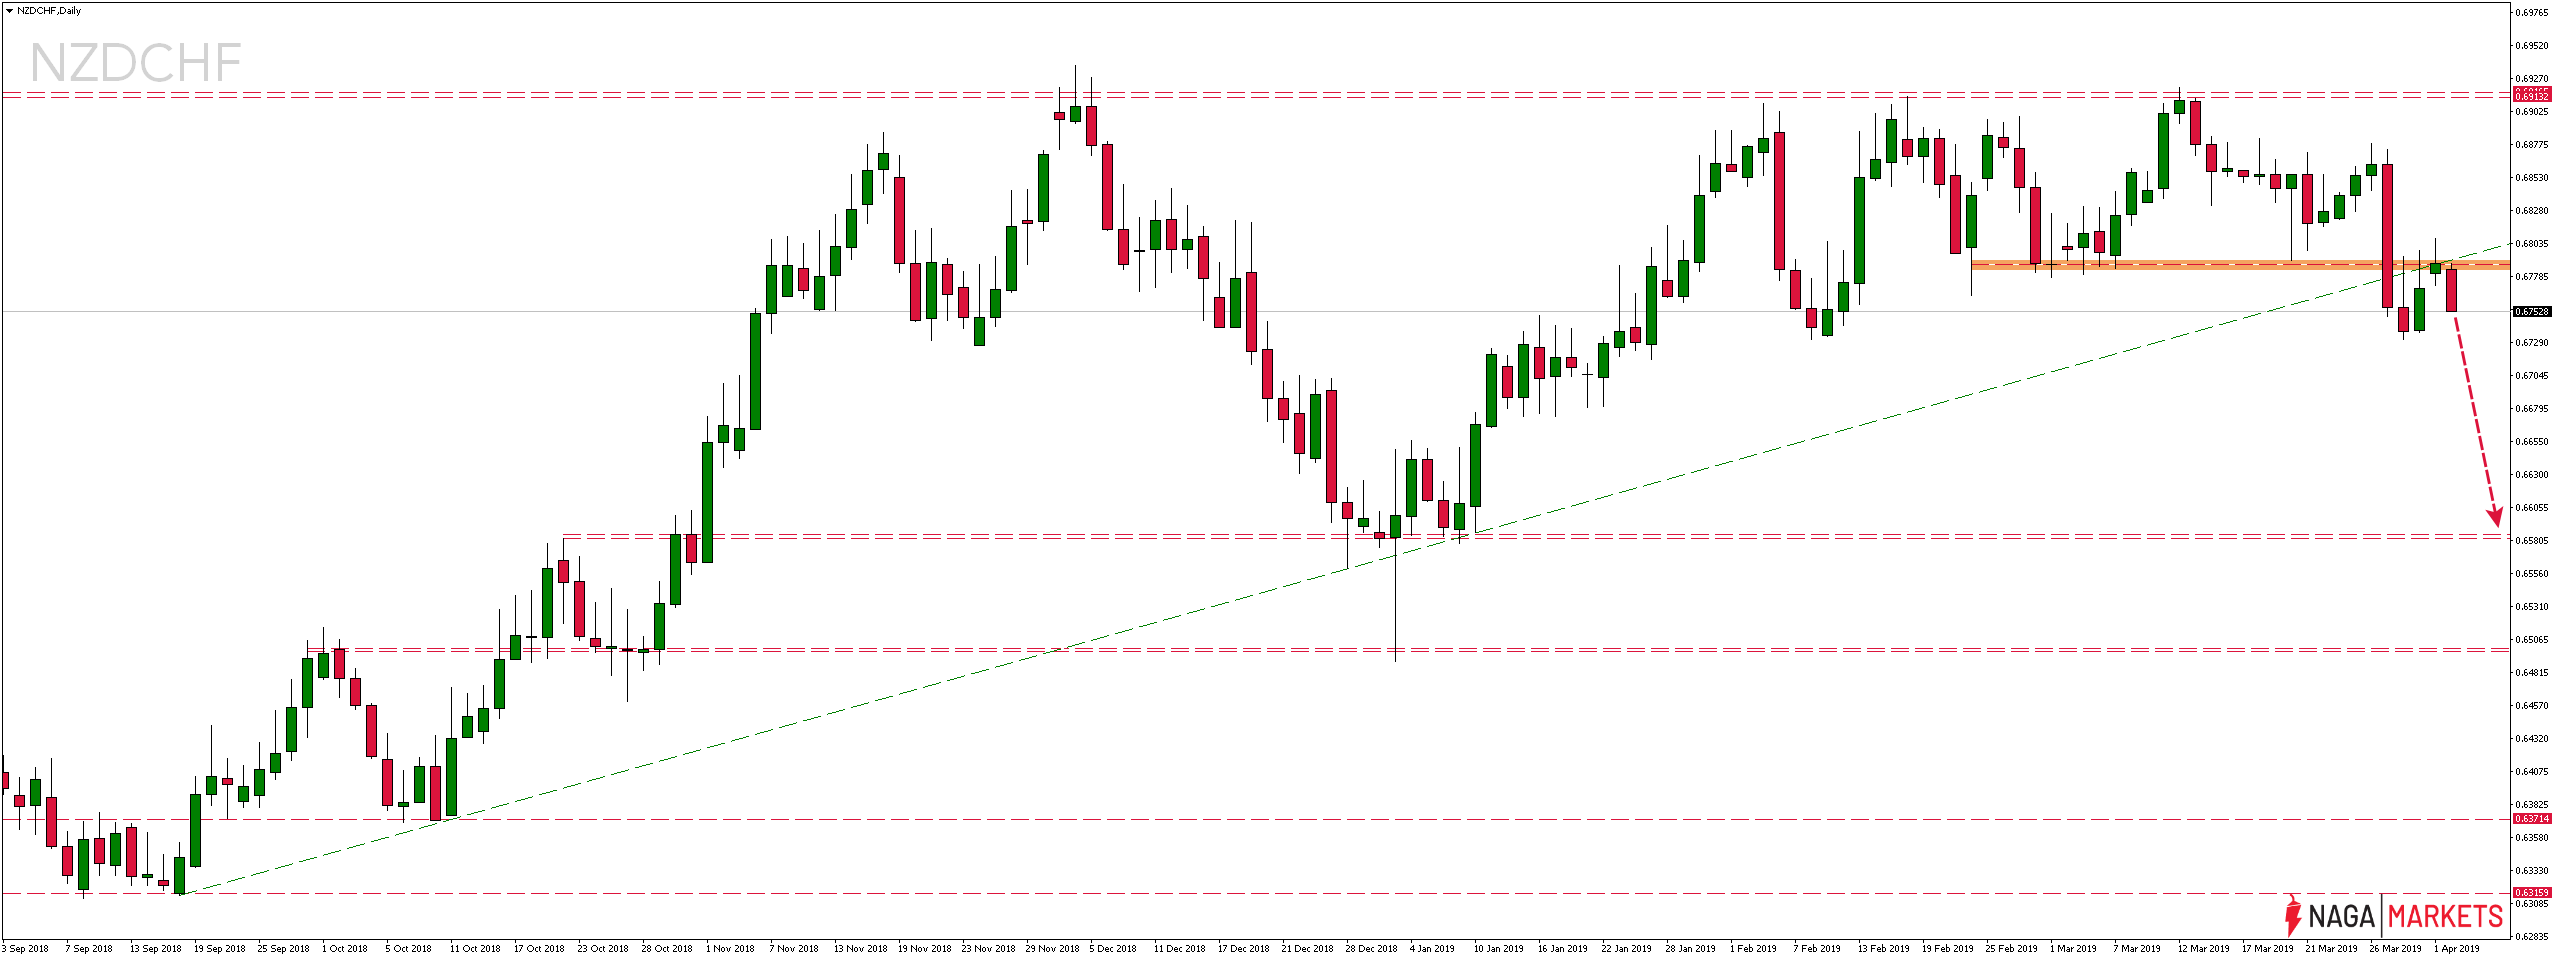 It was the falls triggered by this announcement that led to the simultaneous breaking down from the two formations mentioned above. In accordance with the polar shift principle, which states that each important support after the defeat should be tested from the other side (as resistance), in the last days, there has been a re-test of the lower limits of these formations. In their area, there is another strong supply reaction signalling a potential rejection.
If, therefore, there is no strong demand response in the near future that could negate the current decline, we could expect them to continue. The real range, in this case, seems to be even more than 170 pips away from the current price of 0.6580.


 Review")


