In my last analysis of the NZD/CHF currency pair, I drew attention to the upcoming settlement. The price was trapped between resistance confluence – trend line and horizontal level.
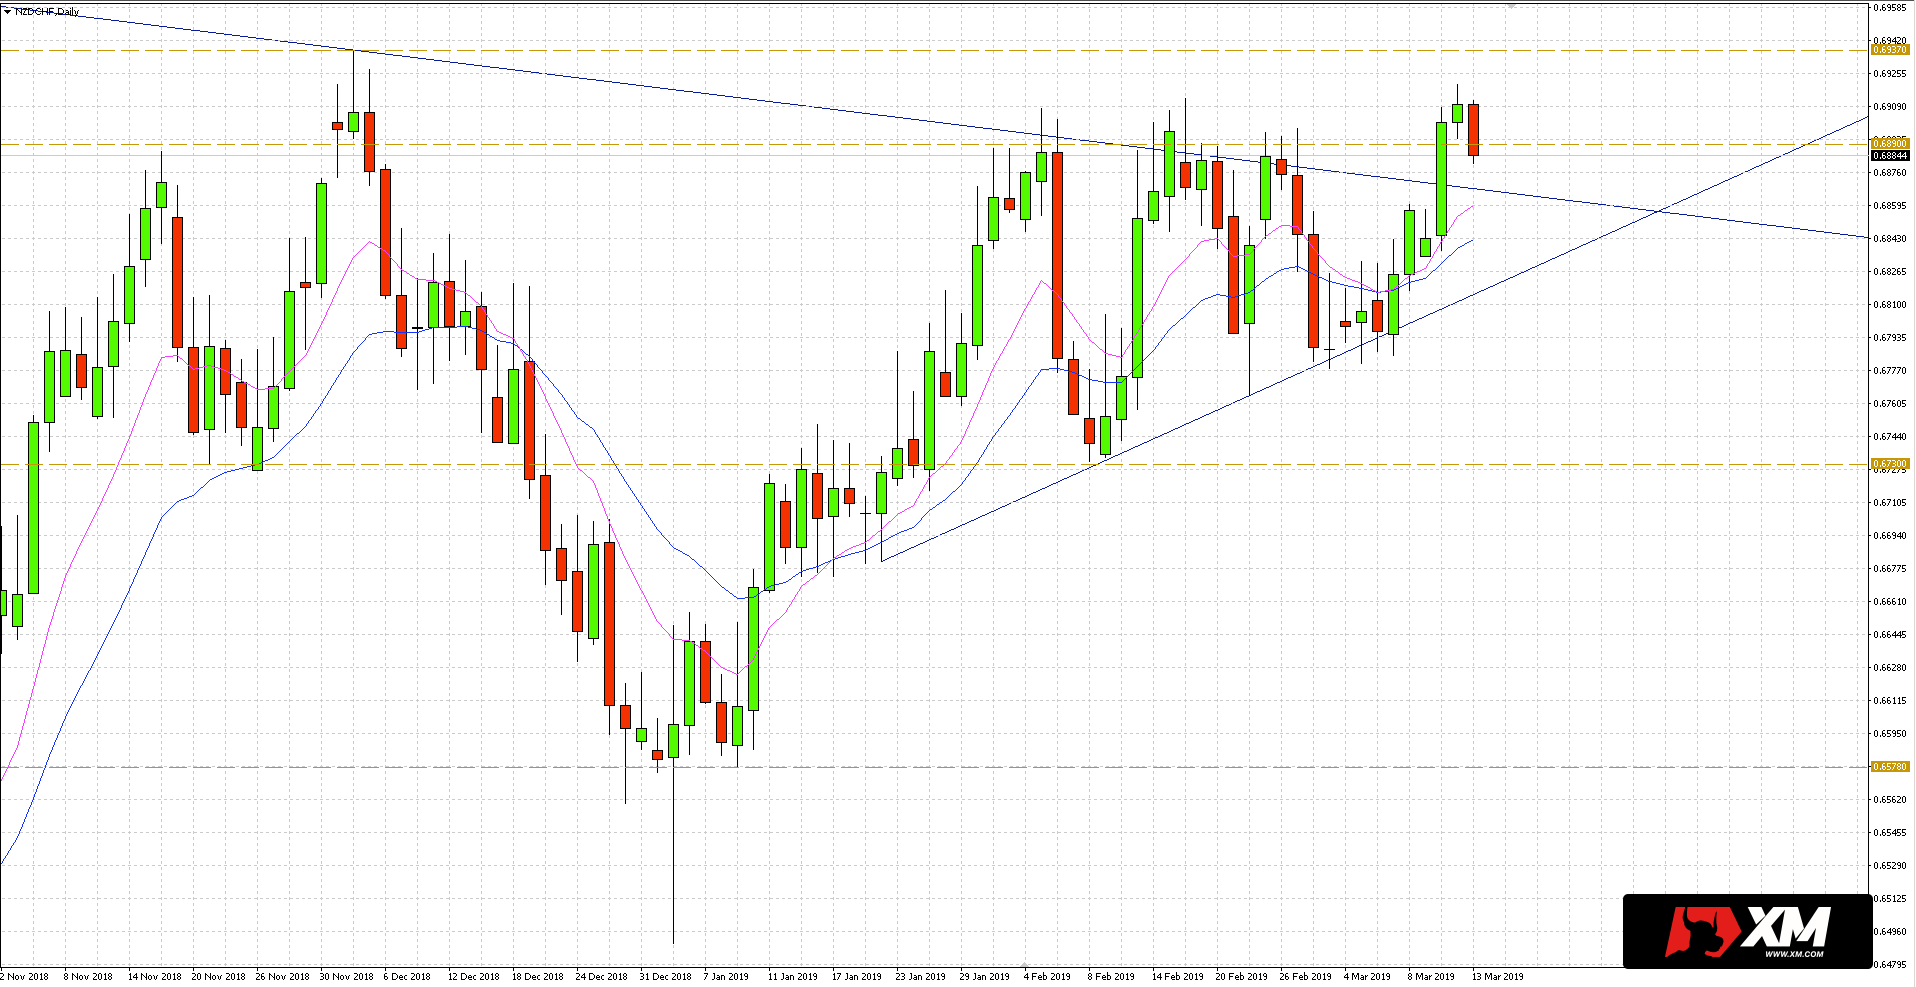
This week seems to be bringing this settlement. On Monday, buyers crossed both the downward trend line running from the peak in July 2017 and the horizontal level of 0.6890. Yesterday, the NZDCHF price rose to the levels of December last year.
With this in mind, there is a chance for further growth. The nearest target may be the maximum of the pin bar from December 2018 to 0.6937, followed by a strong sell-off. Overcoming this level would reveal another resistance of 0.7020.
In case of a reversal, it is worth looking for buying opportunities on the broken upward trend line and the EMA 10/20 medium channel. The surroundings of these levels can now act as a support.


 Review")


