In recent weeks, the NZD/CHF currency pair has been struggling with the zone of resistance confluence, which includes a horizontal level of 0.6910 and a downward trend line running from its peak in July 2017.
This month, the first attack on the resistance zone took place in the week ending on 8 February. It was then that the bearish engulfing formation was formed on the chart. However, in the following week the losses were recovered, which gave a chance for growth.
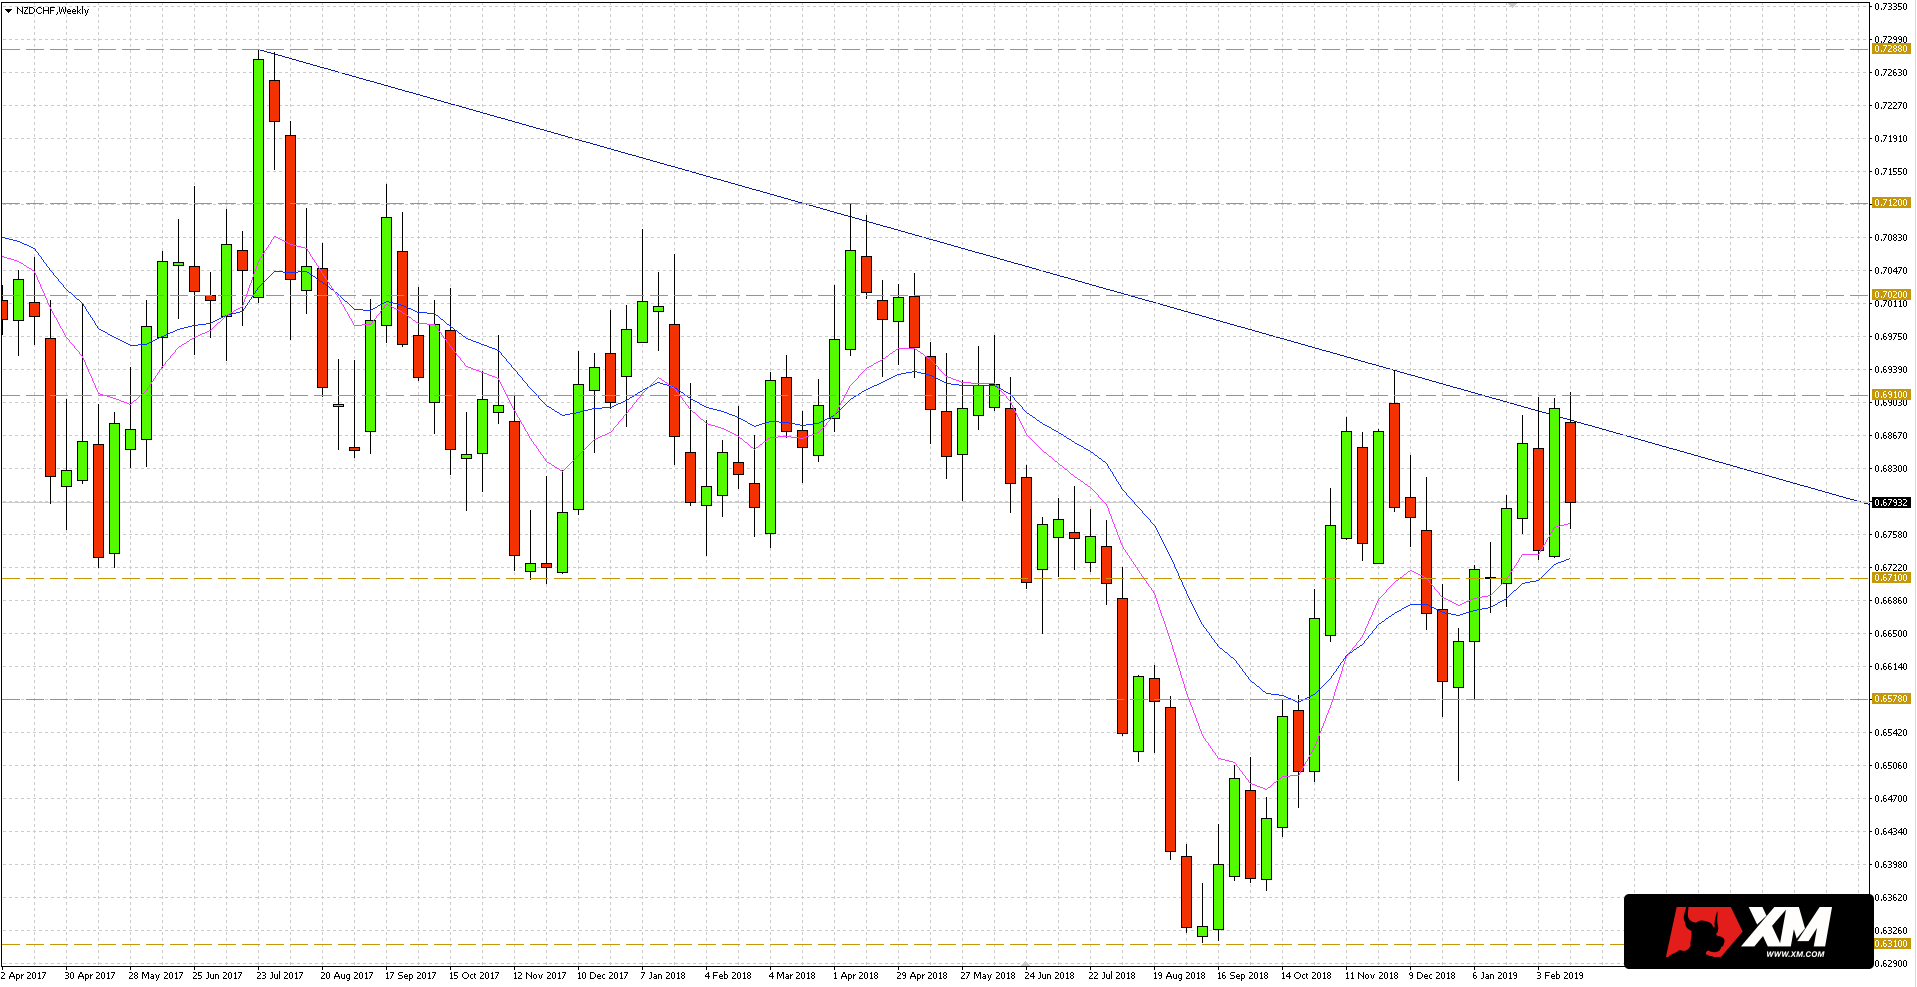 In turn, this week’s quotations set new maximum, but after today’s publication, the NZD slides back to the franc, which indicates respect for the resistance zone.
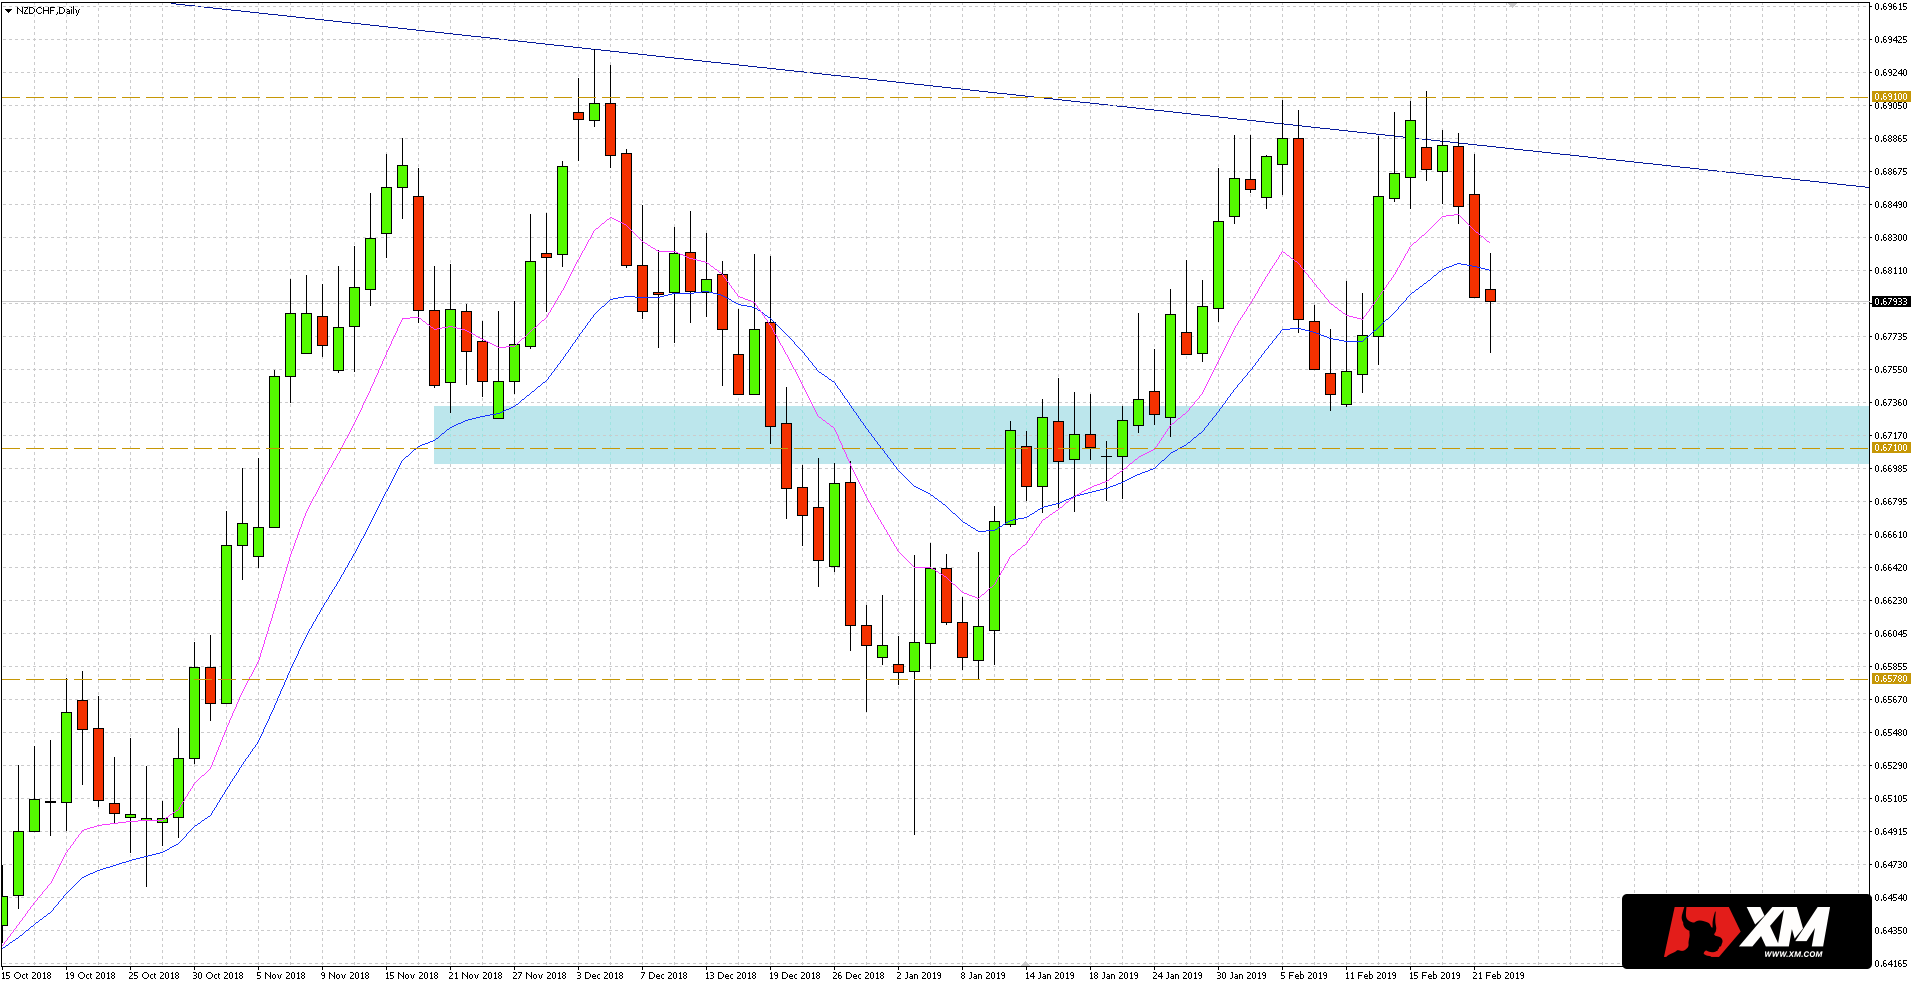 The struggle with the resistance confluence zone is also clearly visible after the transition to the NZDCHF daily chart. As you can see below, the target for sellers after the rebound may be the support zone within level 0.6710. Another important support in case of continued declines is around 0.6578.


 Review")


