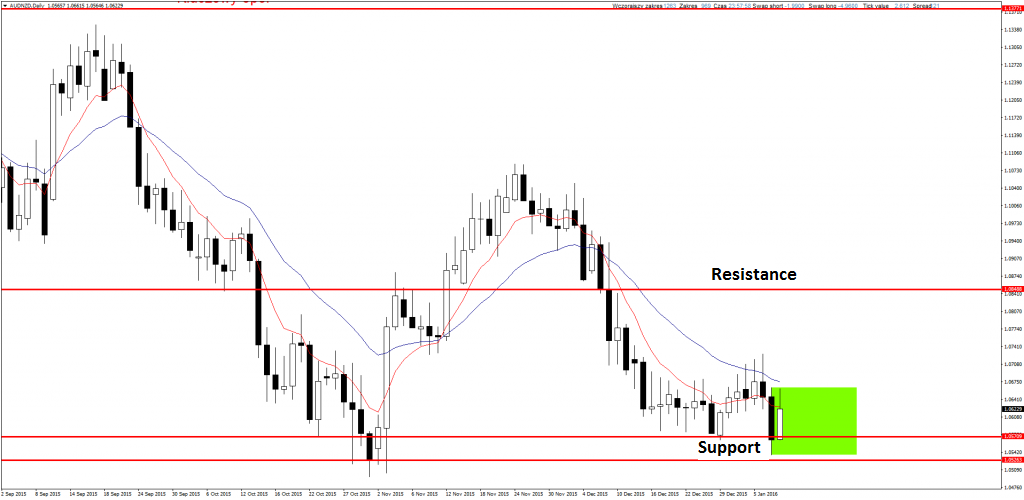
AUDNZD
After test of key support pair rebounded but it is still too little to think about opening position. There is Inside Bar created, after a rebound we can open position, there are 3 possible scenarios:
- Break below and close below mother candle (its range is set on green). Then we can set sell limit order on 50% retracement of signal candle and Stop Loss above it. The condition here is close clearly below support.
- Break below and rebound to mother candle’s range and close in it. Then we can open longs with market price and SL below signal candle.
- Break above and close above mother candle. It will be long signal and I will set buy limit order on 50% retracement of signal candle and SL below it.
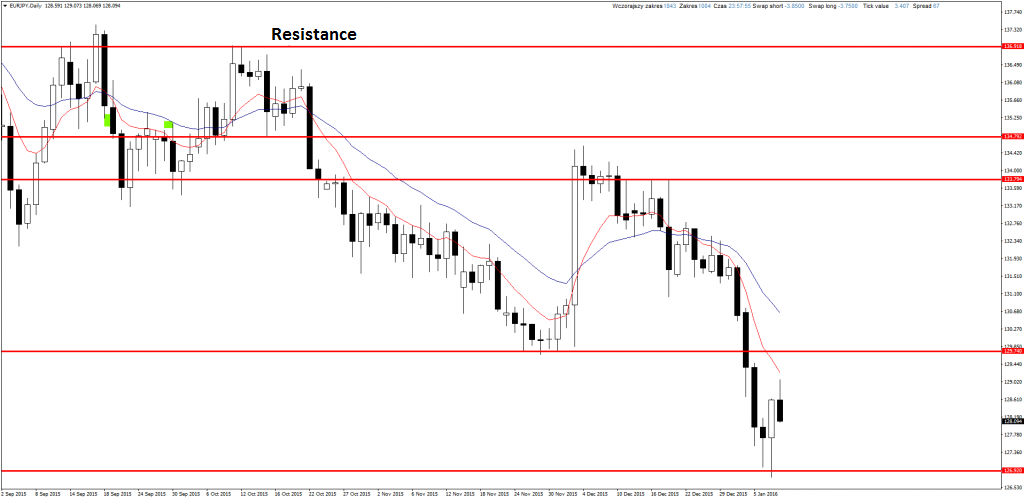
EURJPY
On Thursday buy signal showed up, but trend was strong enough and resistance was so close that there was no sense to consider long position. I still wait for the test of resistance to open shorts later. This position will be consistent with the trend so it is worth to watch both H4 and D1 charts if price will rise to 129.7 area.
If you are interested in Price Action Strategy description, you can read it here.
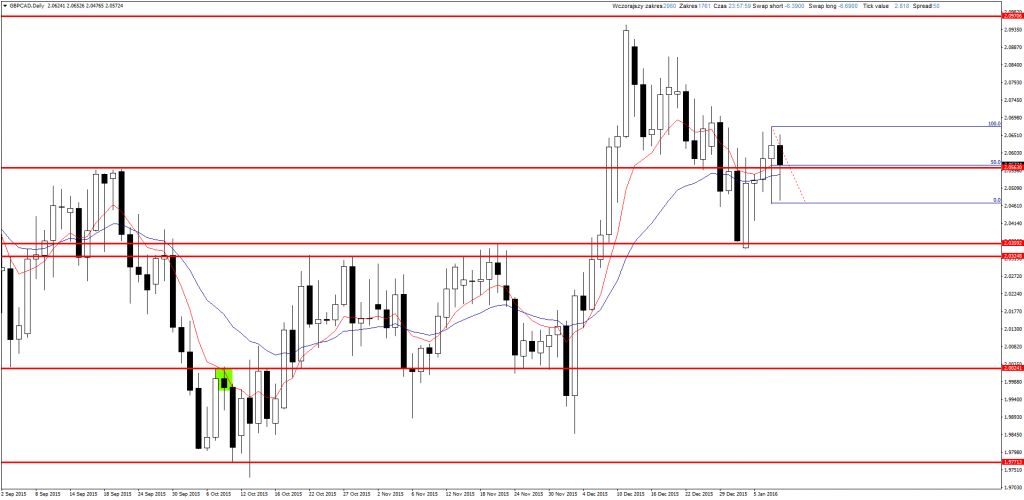
GBPCAD
Here there is my position, I wrote about signal last Friday. For now it is quite nervous but it is because last session. We just have to be patient and wait for further situation.
YOU CAN START USING PRICE ACTION AND INVEST ON FOREX MARKET USING FREE XM BROKER ACCOUNT.
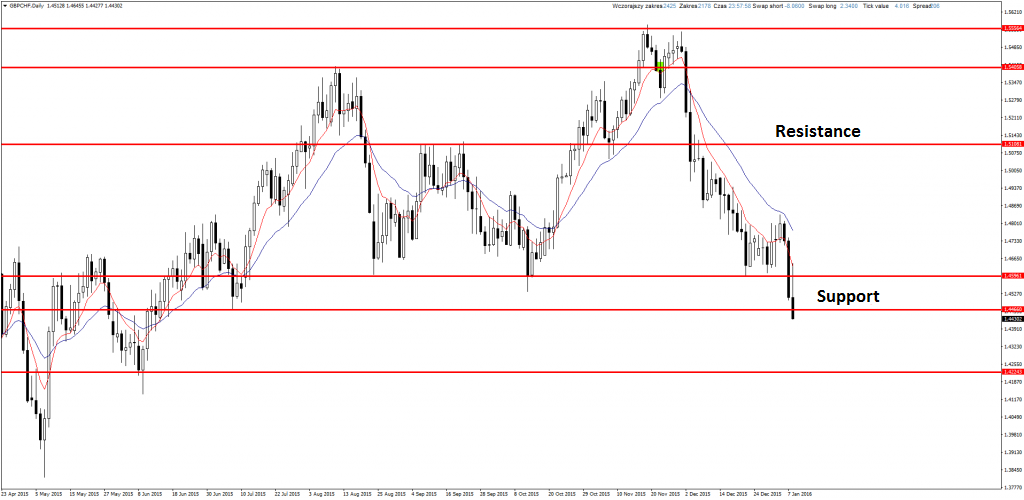
GBPCHF
This pair is decreasing quite strong. On Friday support was broke and it seems like we can look for opportunities to play shorts. If there will be any bullish correction which will test earlier support (now it should become resistance), we can play shorts from H4 or D1 chart.
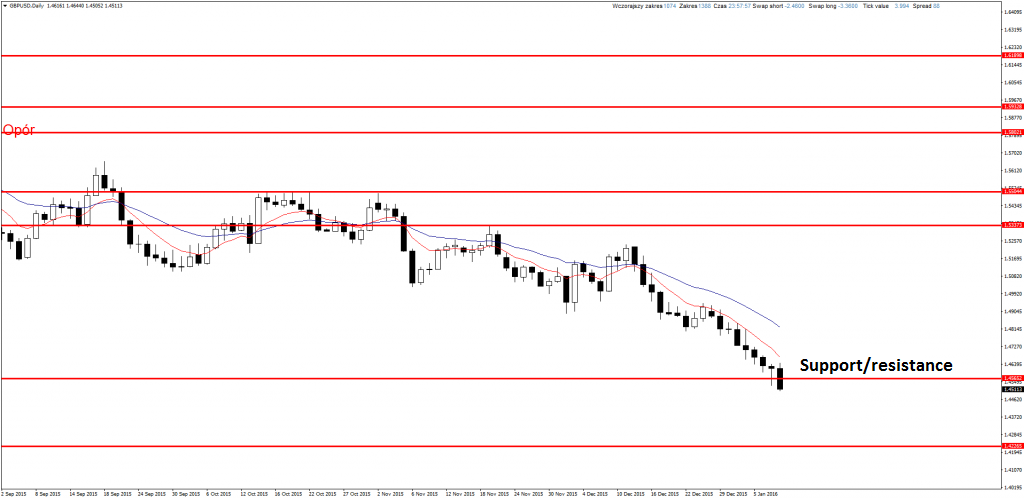
GBPUSD
Very similar situation on Cable. There is also key support broken and in near time there can be opportunity to join so strong bearish trend.
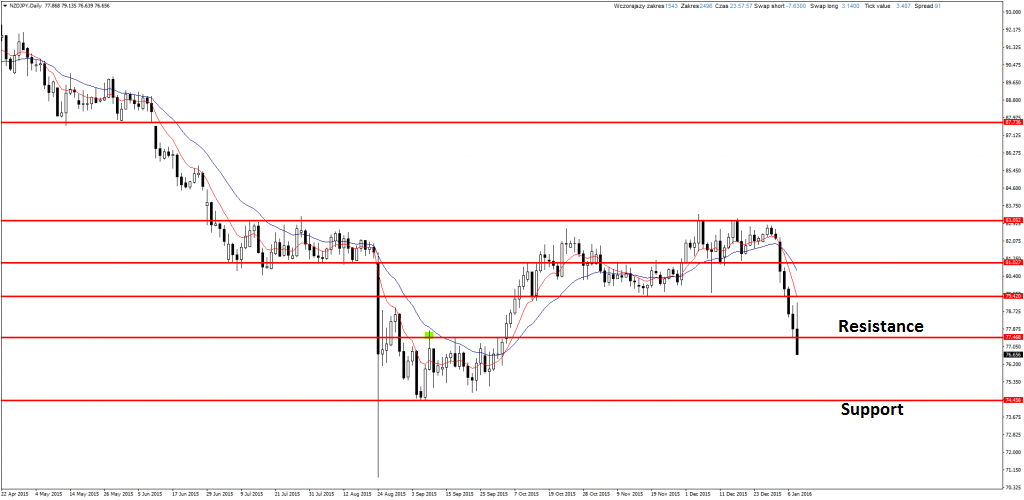
NZDJPY
Situation is very similar to two pairs above. Clear break of support and now it should turn into resistance what will let us open short position after re-test from below.
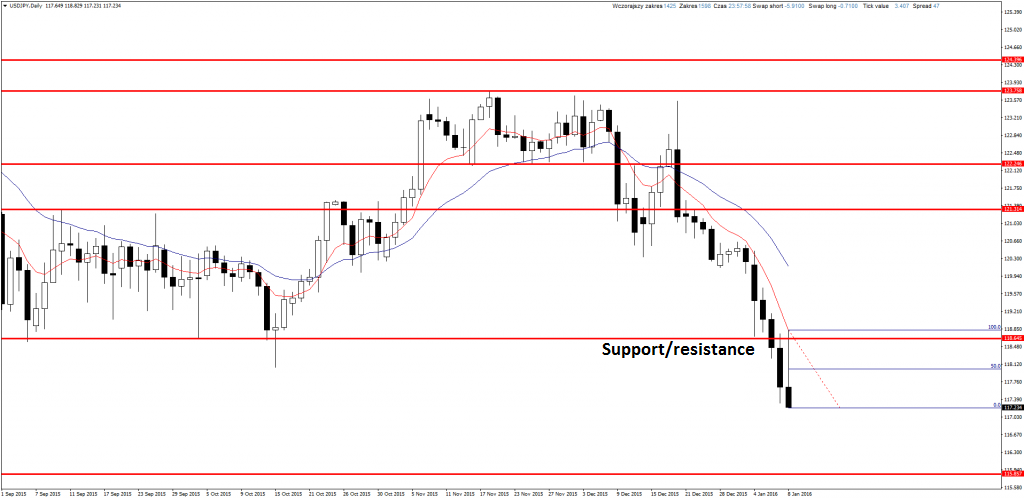
USDJPY
Big sell signal on this pair. It needs as much as 100 pips of SL, and TP is just a little more than 200 pips, but it is clear and consistent with strong trend.
If this SL is too big, we can wait for bullish correction and another test of resistance. On H4 chart there was opportunity in shape of Pin Bar but it wasn’t tested on 50% and we couldn’t open position. Now price is away for more than 2.5x SL so we have to wait for another opportunity.


 Review")


