“Search, Analyse, Trade” is a series of Price Action and Elliott Waves analyses. Its detailed step-by-step description can be found over here. I invite you to today’s review of selected currency pairs and potential trading opportunities. The analyses are based on the Dukascopy sentiment that you can get here.
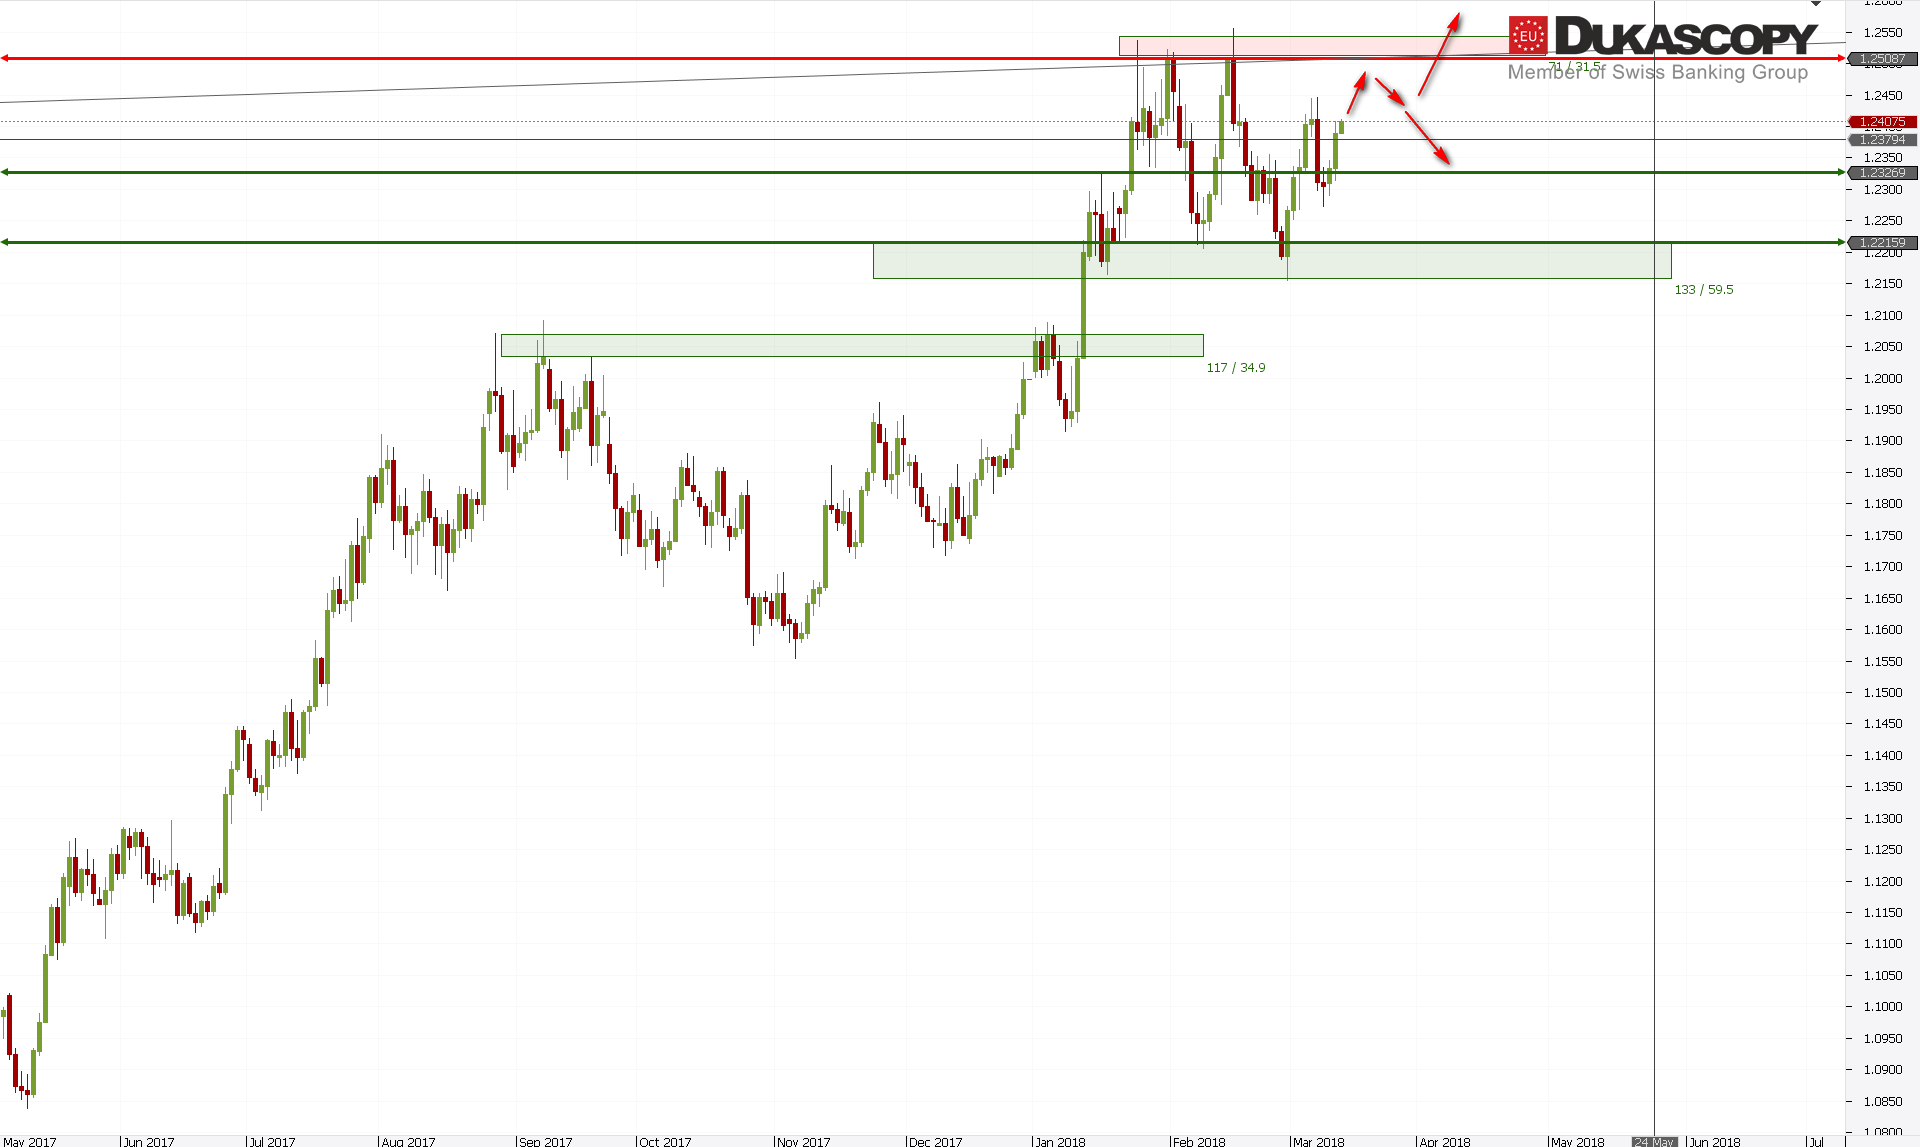
After a series of tests of the internal support / resistance line, EUR/USD moved towards key resistance zone. If the currently viewed increase is the third wave of the last sequence or the C wave in wave B of the larger correction, then the currently tested resistance should be defeated in the near future and the pair should test the last high. This test will determine whether the pair will return to the trend, or will stay longer in consolidation, and lateral movement will be extended in time.
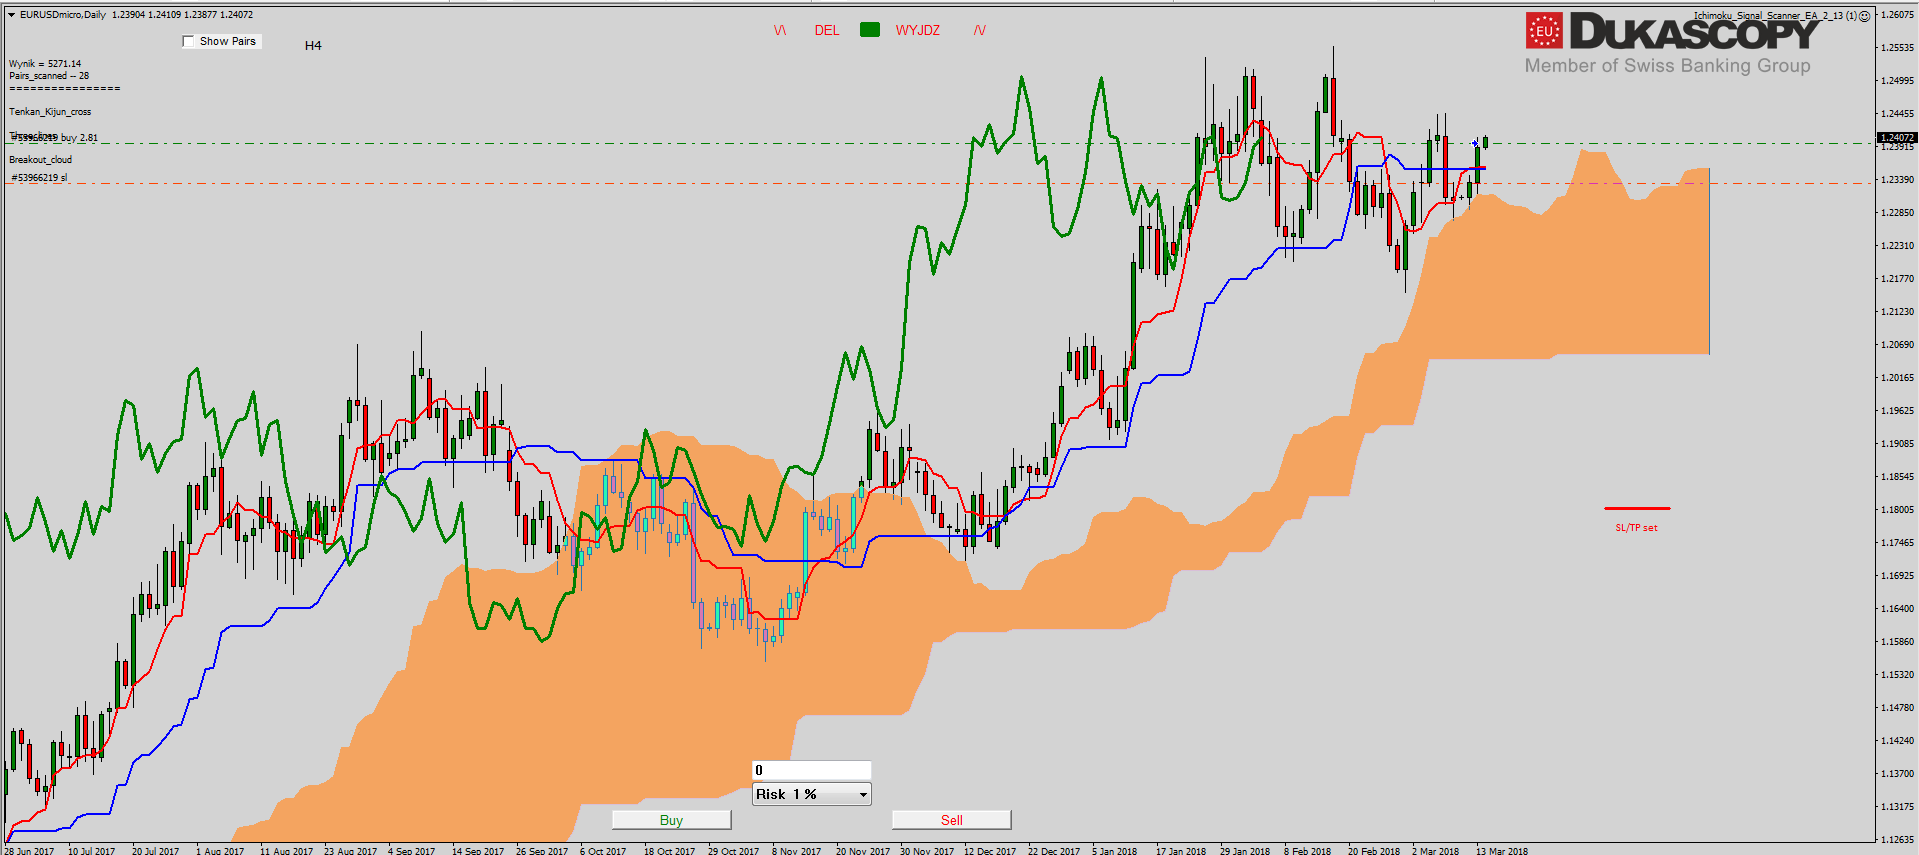
On the Ichimoku chart, we can see that the last drop has led to the Senkou Span A line test, which worked as support. The pair moved up, and Tenkan and Kijun lines cut through, giving a buy signal. The signal is slightly weakened by the Chikou line, which remains below the price. Also, both Tenkan and Kijun lines remain flat which can attract the price and in the near future we can see their test from the top.
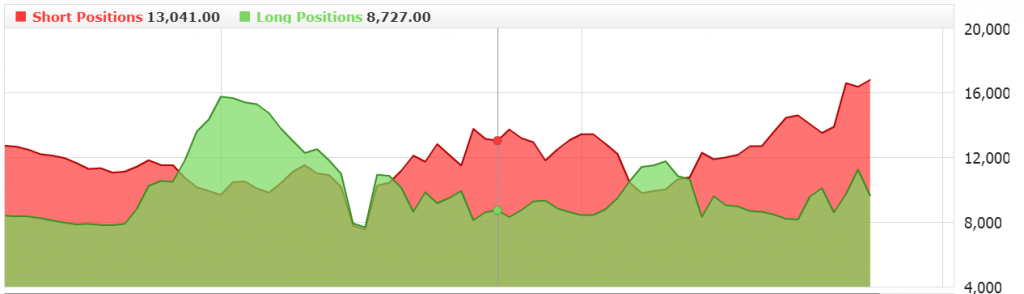
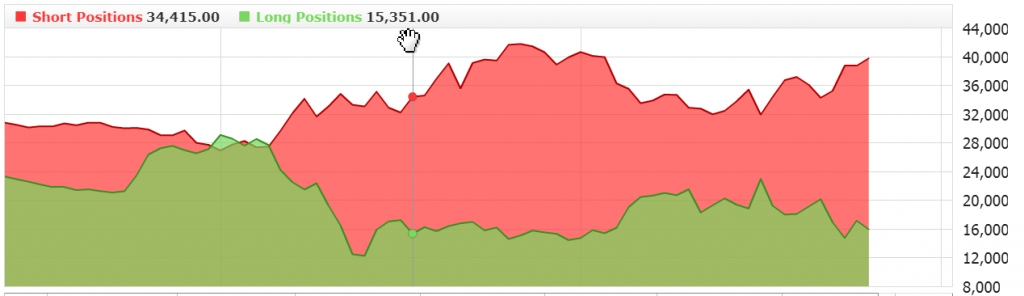 Sentiment evidently puts itself under declines. Players do not believe in a successful attack on the top and occupy short positions, while reducing long. Such a system, of course, does not allow to open a long position, so you have to watch and wait for the break out from consolidation.
The partner of “Search, Analyse, Trade” series is a Dukascopy Europe broker who gives its customers access to ECN accounts in different currencies.
Trade on Forex, indices and commodities thanks to Swiss FX & CFD Marketplace. Open free trading account right now.
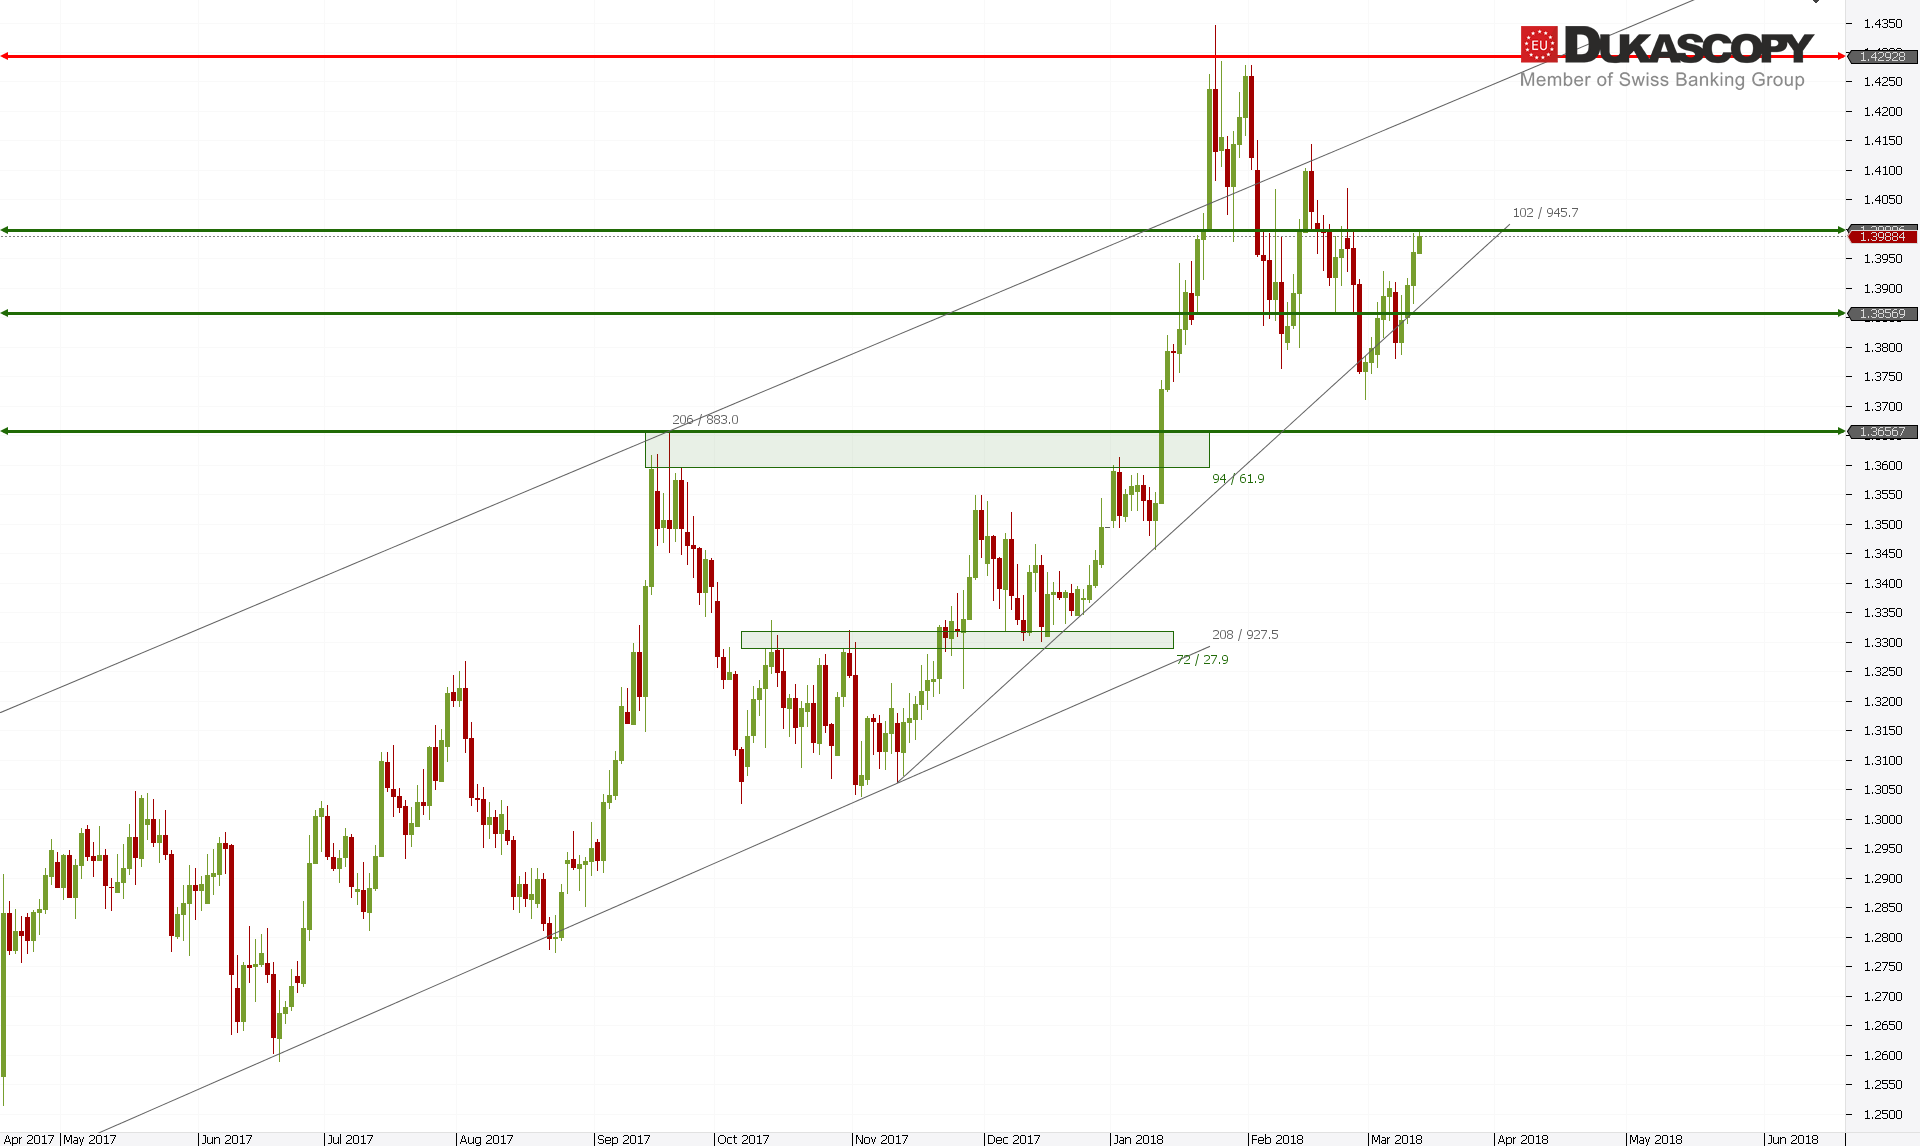
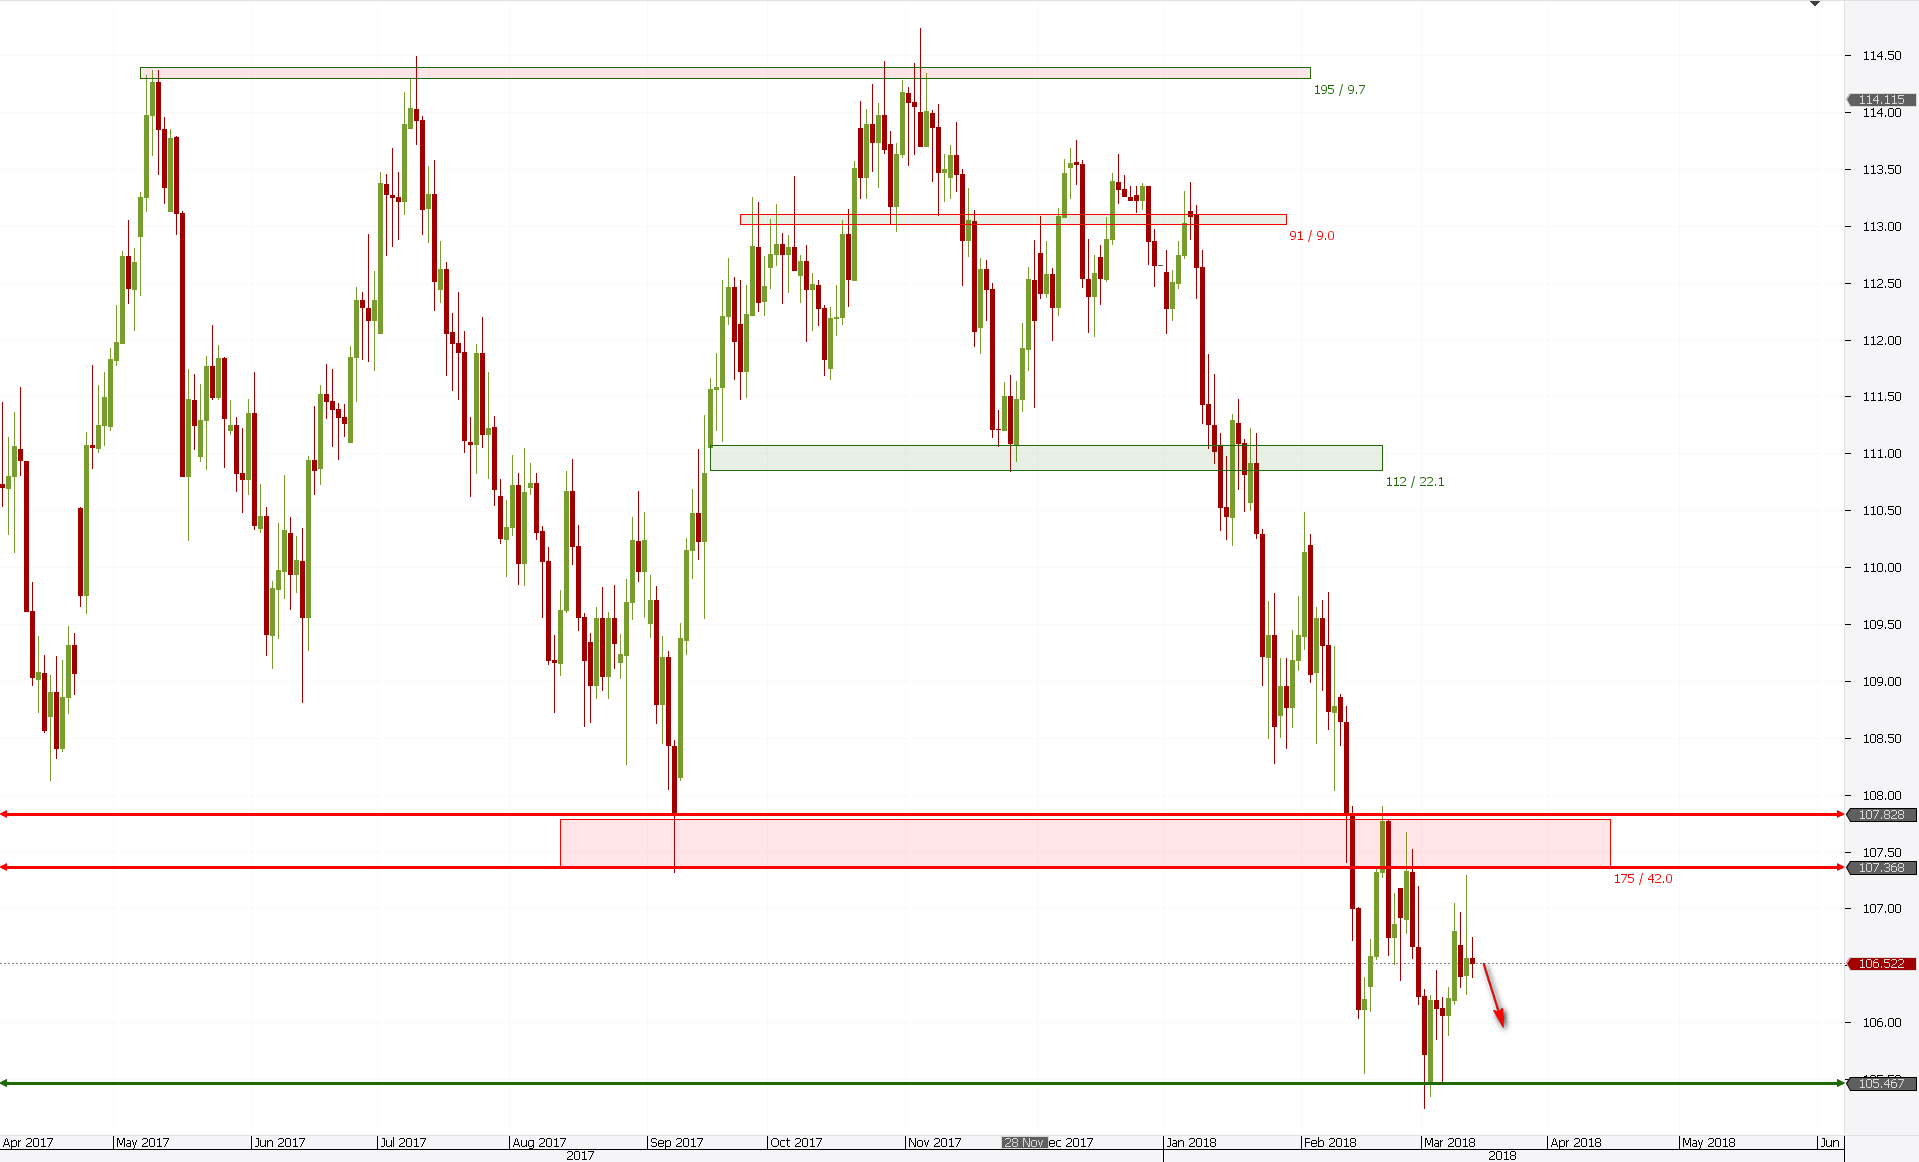
Also the pair GBP/USD has reacted positively to support and defended the accelerated trend line. Currently, the pair is testing the inner resistance zone. Its defeat will open the way towards the next zone, which is 70 pips higher. The test will clarify whether the observed increase is more or just a C wave in irregular adjustment and after it we will see another drop in the 3C wave of higher level.

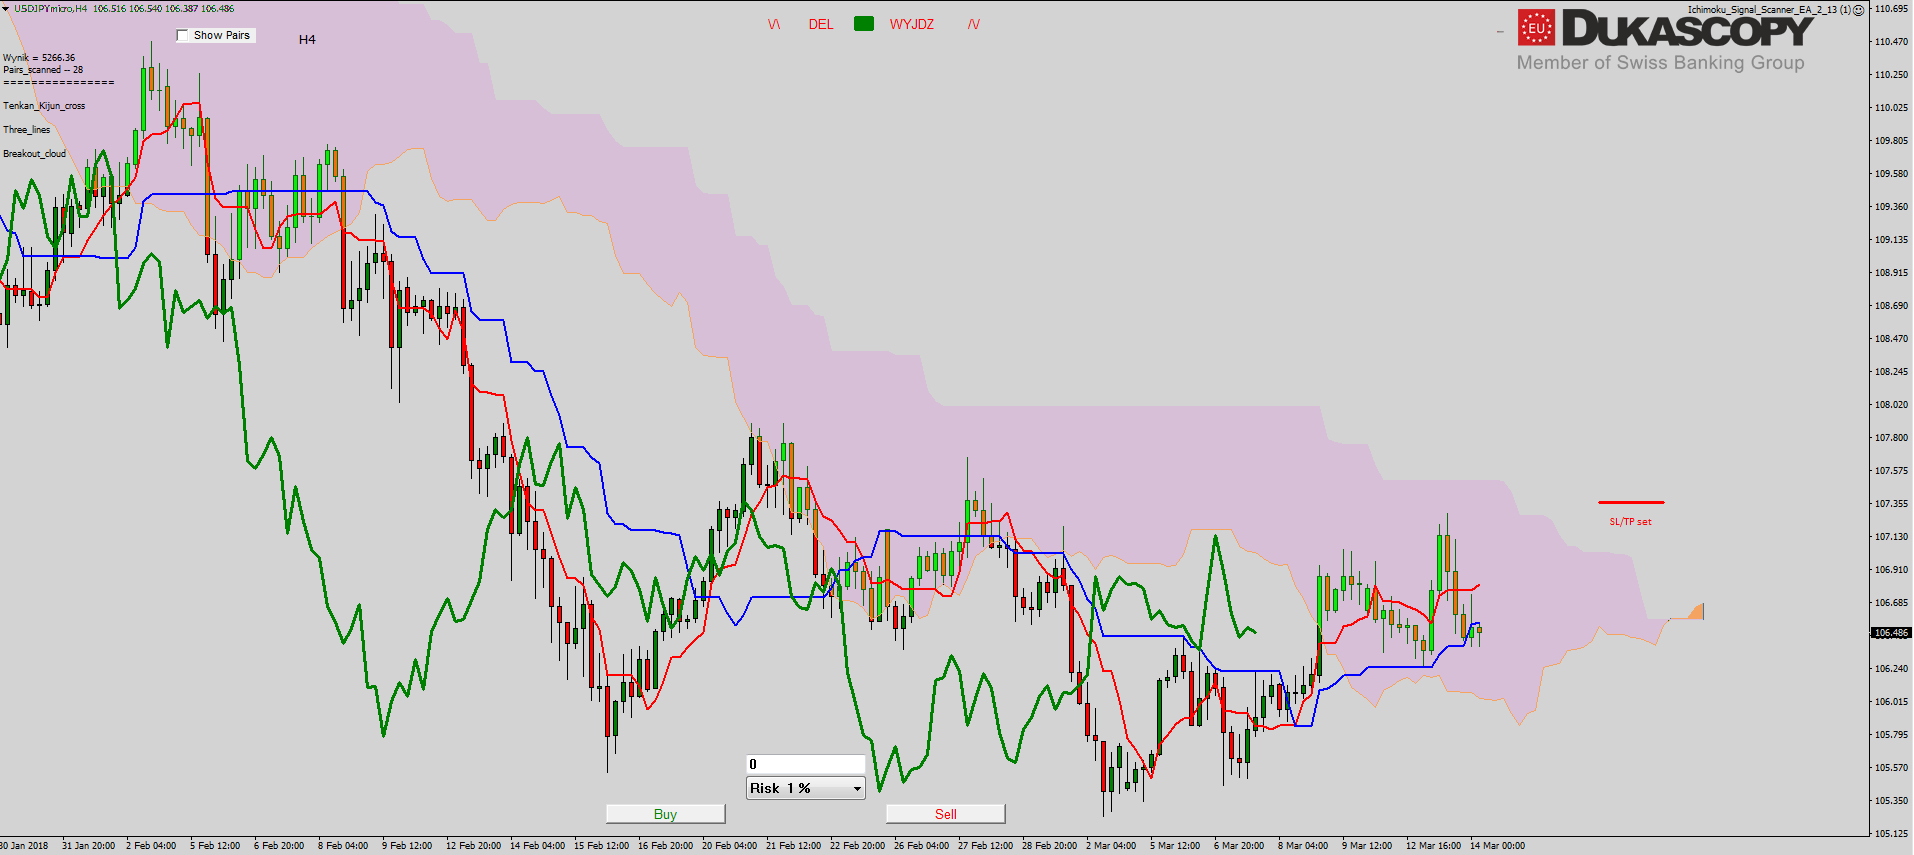
On the daily chart of Ichimoku, the pair defeated the Kijun line and reached the Senkou Span A line and currently is testing it. Both lines are now laid flat and gently approach each other. The Chikou line is currently fighting against the price line. If the pair overcomes the upper limit of the cloud, we will have a buy signal. In the H4 chart, such a signal appeared yesterday. The pair from the low created a wave 1A. Correction falsely broke the cloud and came back to it, creating a wave i. A cross appeared inside the cloud and on the next day the pair emerged from it forming a wave 3C. As we know from the daily chart, the pair struggles with the Senkou Span A line, and because the Senkou Span B line from the H4 chart is long and flat, one can expect a correction and its re-test.
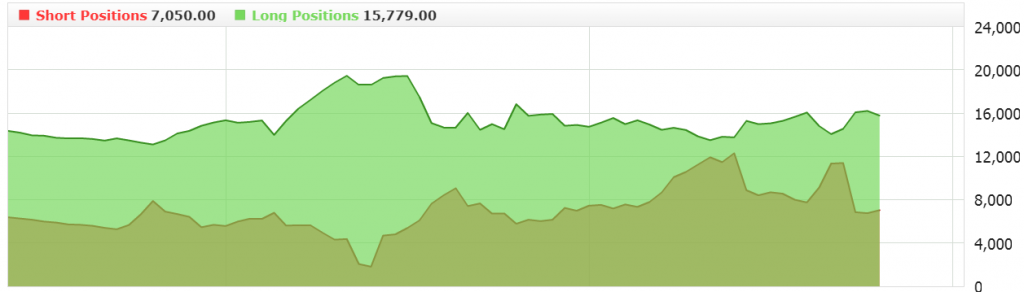
 Similarly to the EUR/USD pair, here the sentiment is typically bearish. We see a very strong move towards short positions, which of course does not allow for opening longs.
 Shortly about USD/JPY because its image does not change at all. The pair is still closed between the zones. Yesterday, the pair once again rejected with Pin Bar the lower limit of the resistance zone and now creates the Inside Bar. Movement in both directions seems equally probable, so you have to wait for breaking one of the zones.
 On the Ichimoku chart, the pair have been inside the cloud for a long time balancing between Tenkan and Kijun lines, which have recently given a weak buy signal creating a cross under the cloud. Breaking down from the cloud should complete the correction and give a sell signal.


 Review")


