Welcome to weekly market overwiev, where we look for Price Action patterns and/or use Elliott Wave Theory.
EUR/AUD
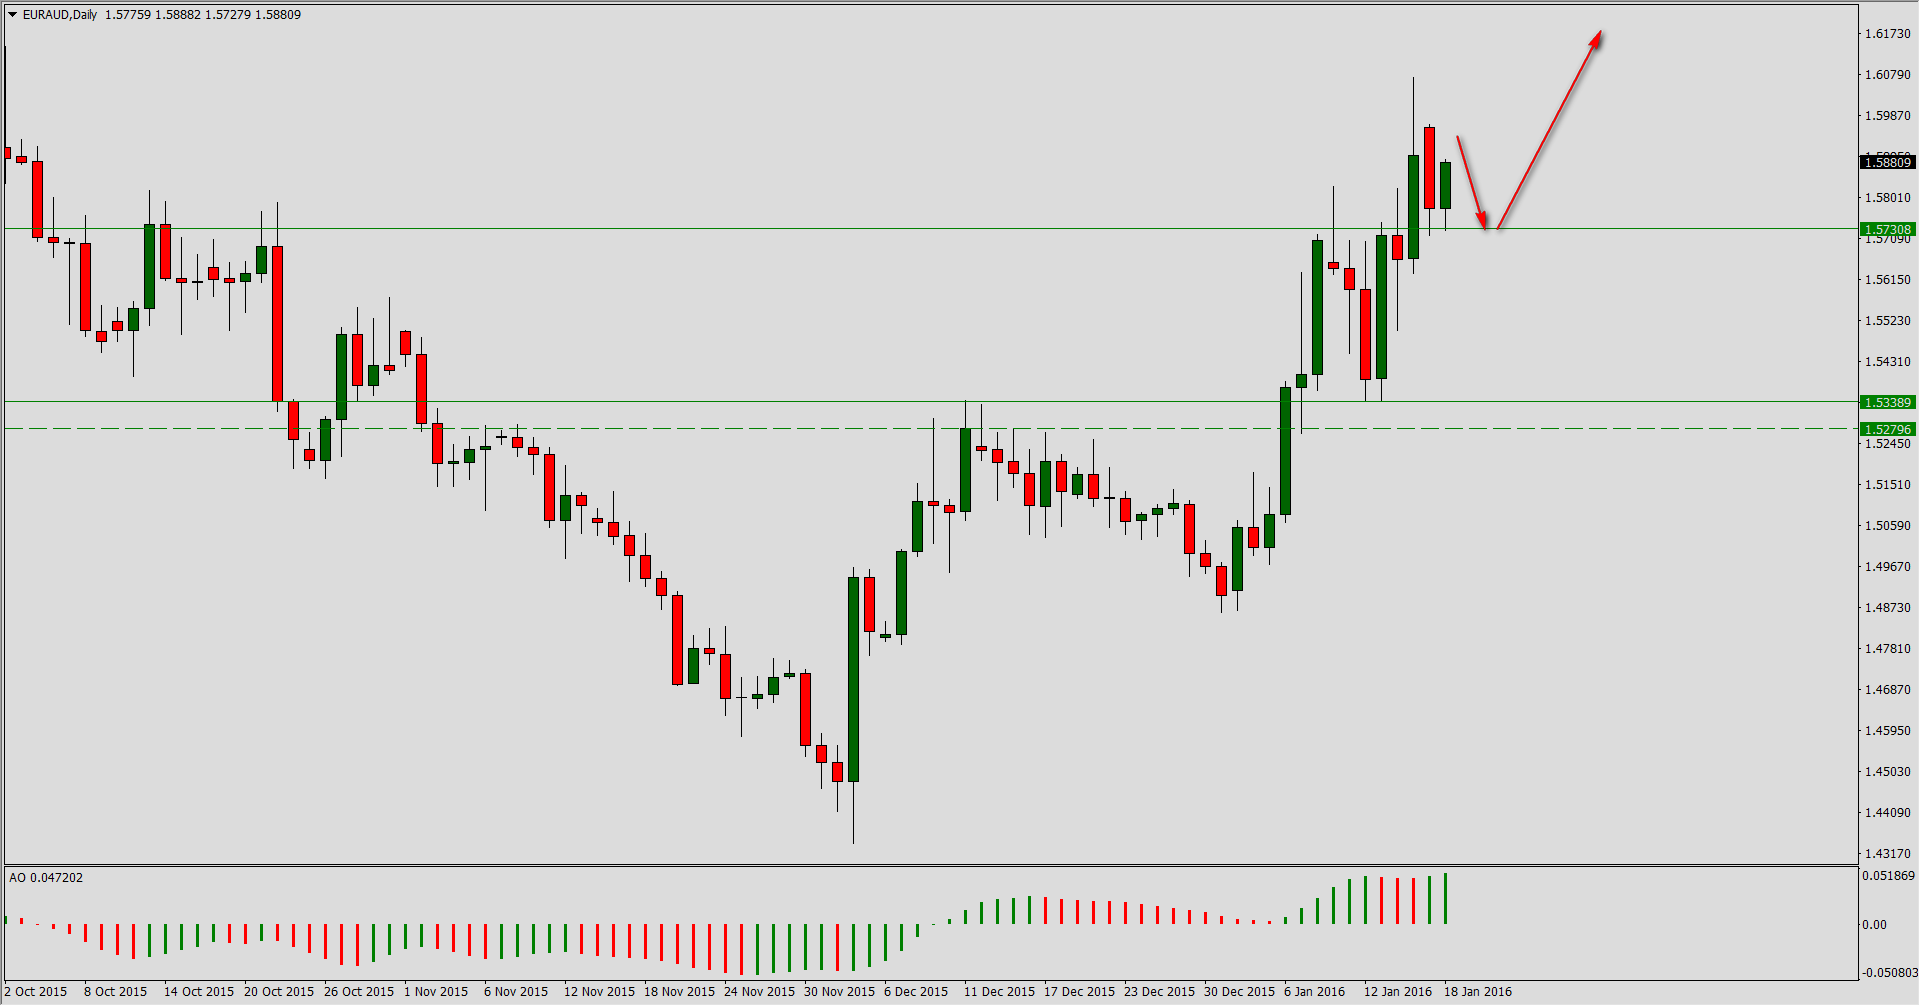
Cross currency pair moves in a dynamic upward momentum. We are approaching a resistance zone in the shape of the mid-August 2015 high. The last appreciation with started around December 2015 may be a third wave or C-wave of the upward impulse. In the nearest future we should see a correction in the shape of the fourth wave. I do not know if third/C-wave has ended, so I look for long opportunities after the test of the closest support (1.5700-1.5730).
GBP/JPY
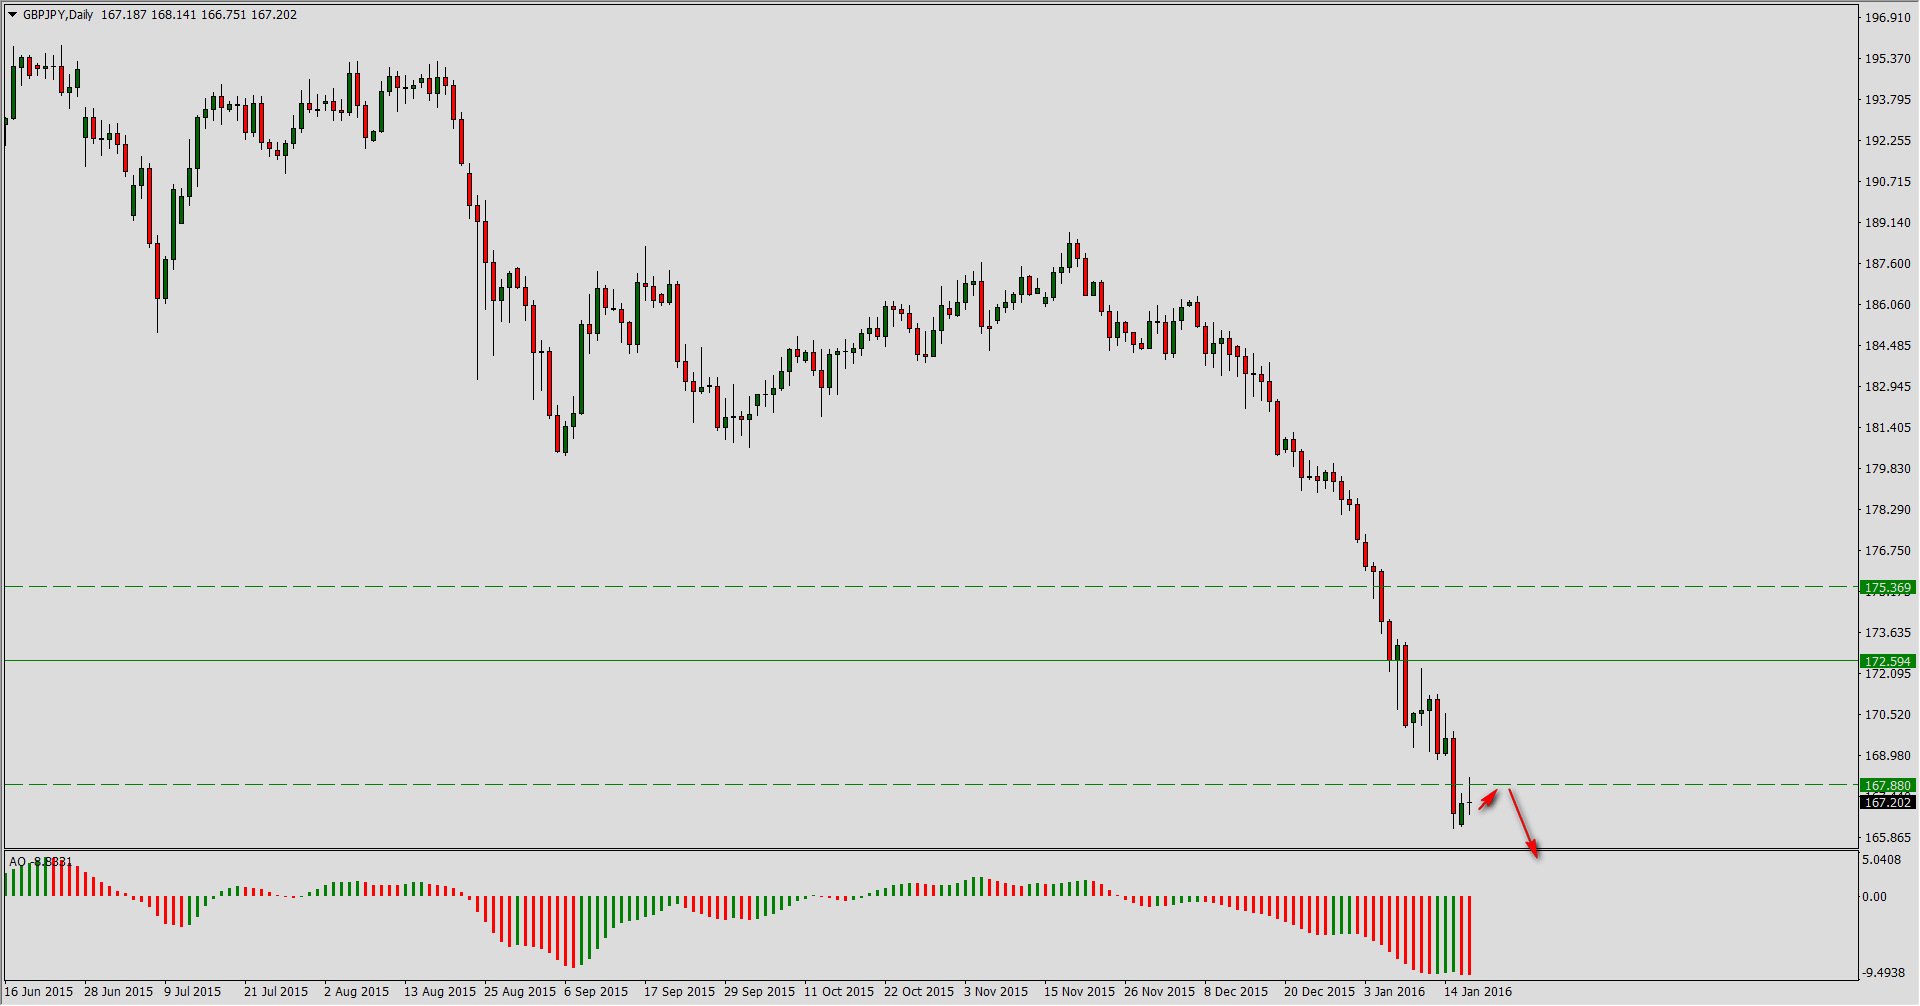
Pound to yen moves inside third wave. Last week touched the resistance zone (from weekly chart) marked with dotted line. Daily chart moves now below mentioned support. Trend is vital so re-test of the S/R zone will be an opportunity to open short positions.
EUR/JPY
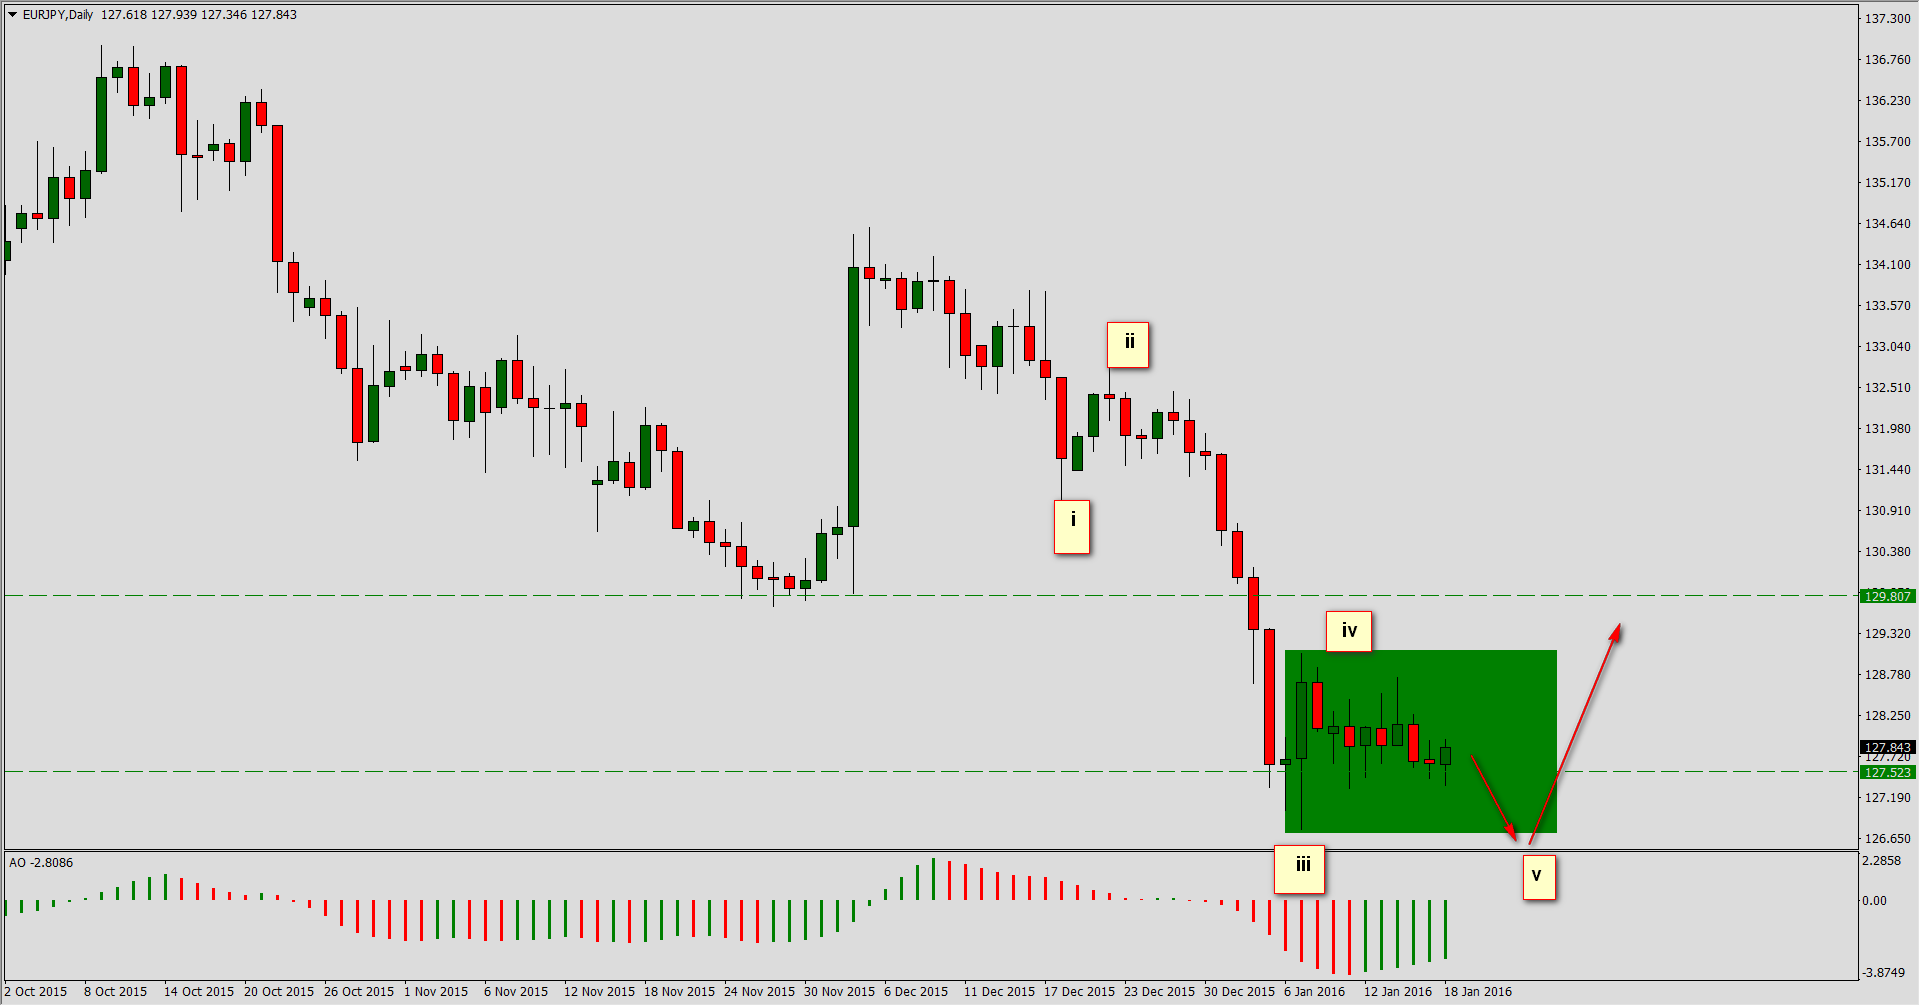
Currency pair moves above important support – huge inside bar formed. Using waves methodology we should wait for a decline approaching the lower band of the inside bar pattern and look there for potential long positions (e.g. after false break of the range).
NZD/USD
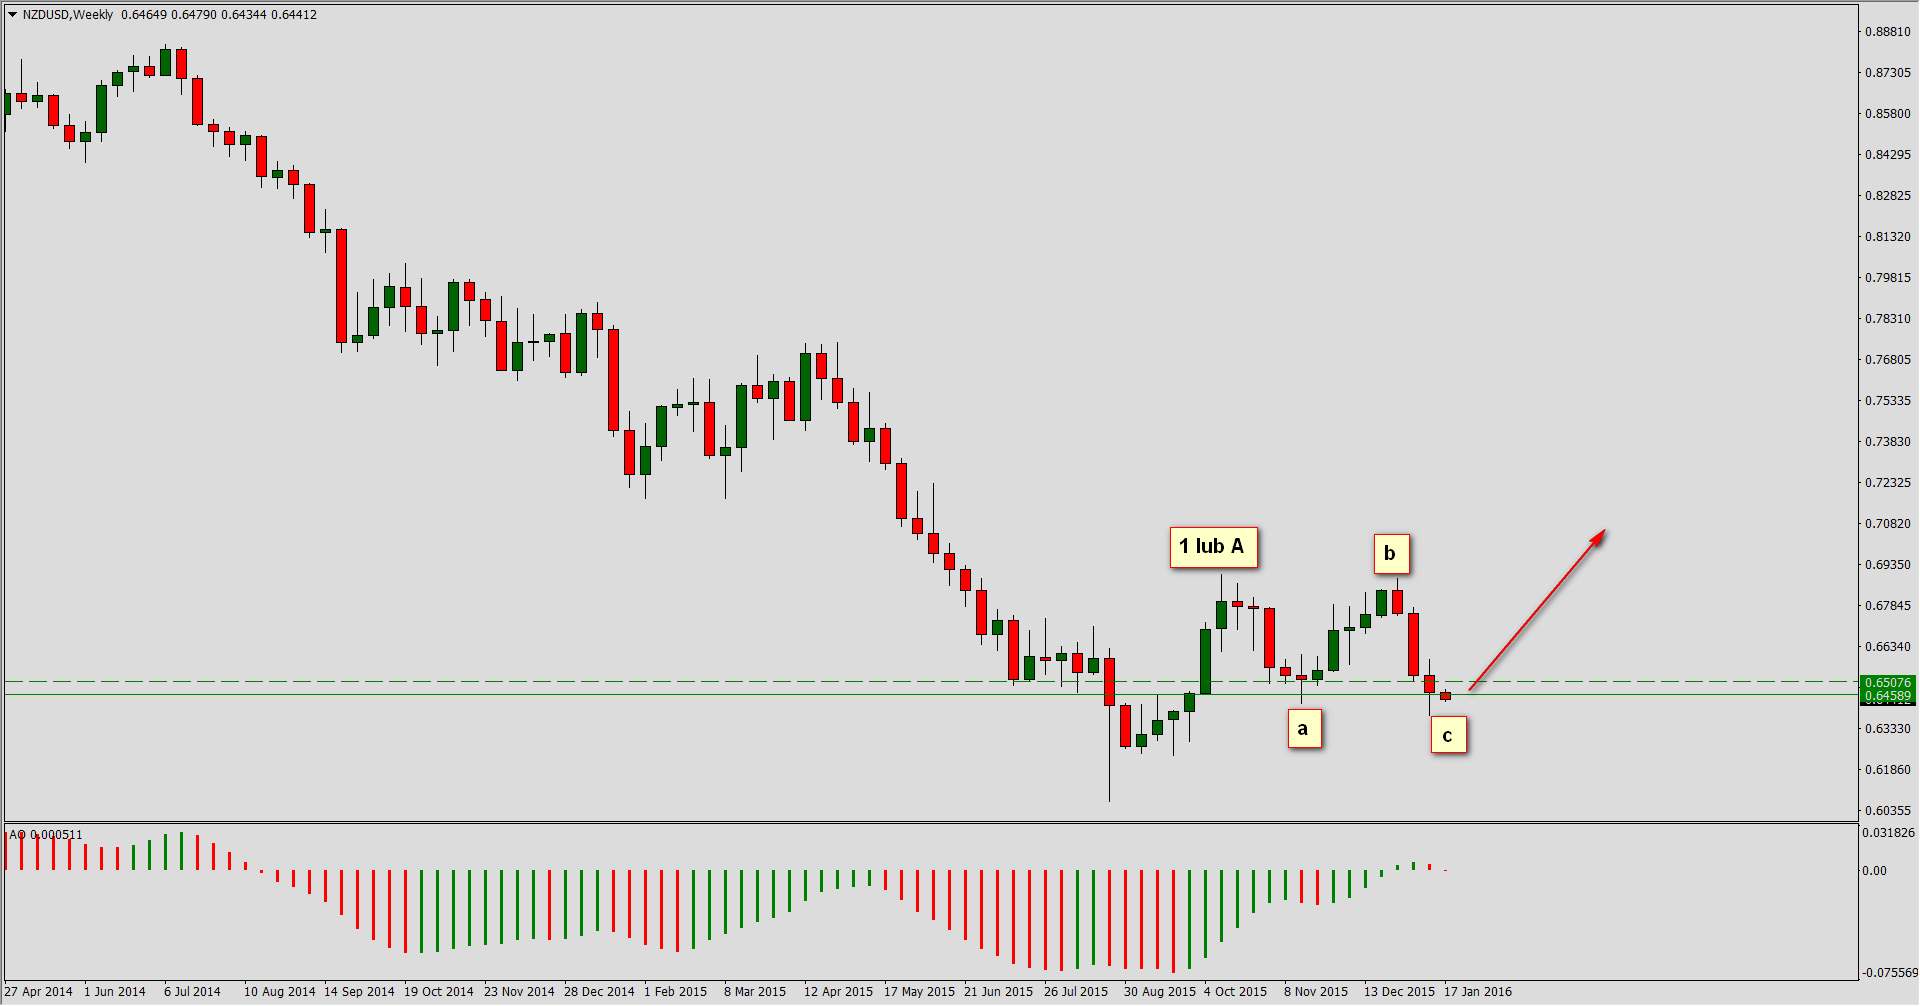
Kiwi looks really interesting. If we assume, that increase from the low is an 1A wave and the current decline (five wave) is a C-wave of the irregular correction, then we are approaching an opportunity to trade long. Daily and weekly charts give nice support levels – it is worth to observe the situation.


 Review")


