„Searching, Analysing, Trading” is a series of analyses designed for an investment strategy based on Price Action and Elliott Waves. Its step-by-step description can be found at this link. We kindly invite you to follow our today’s review of selected currency pairs and potential opportunities for transactions.
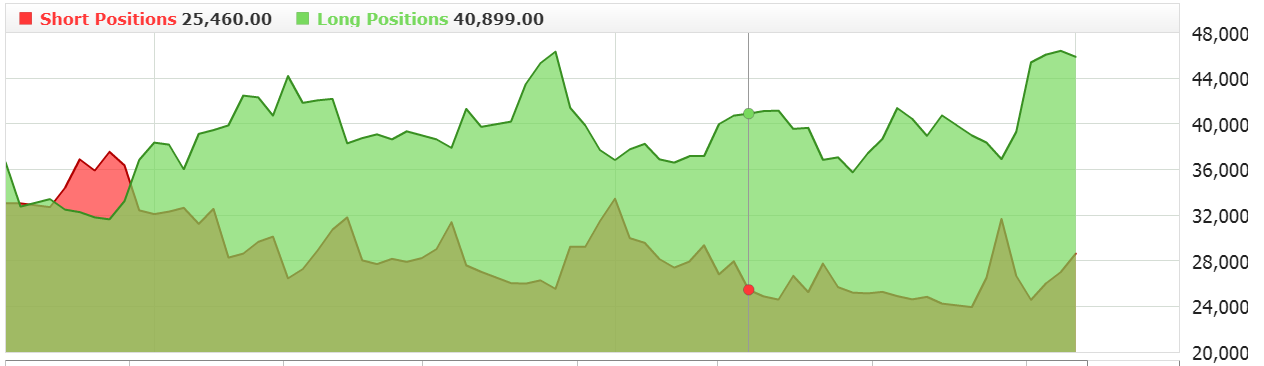
Our analyses are prepared based on Ducascopy’s SWFX Sentiment Index, available here.
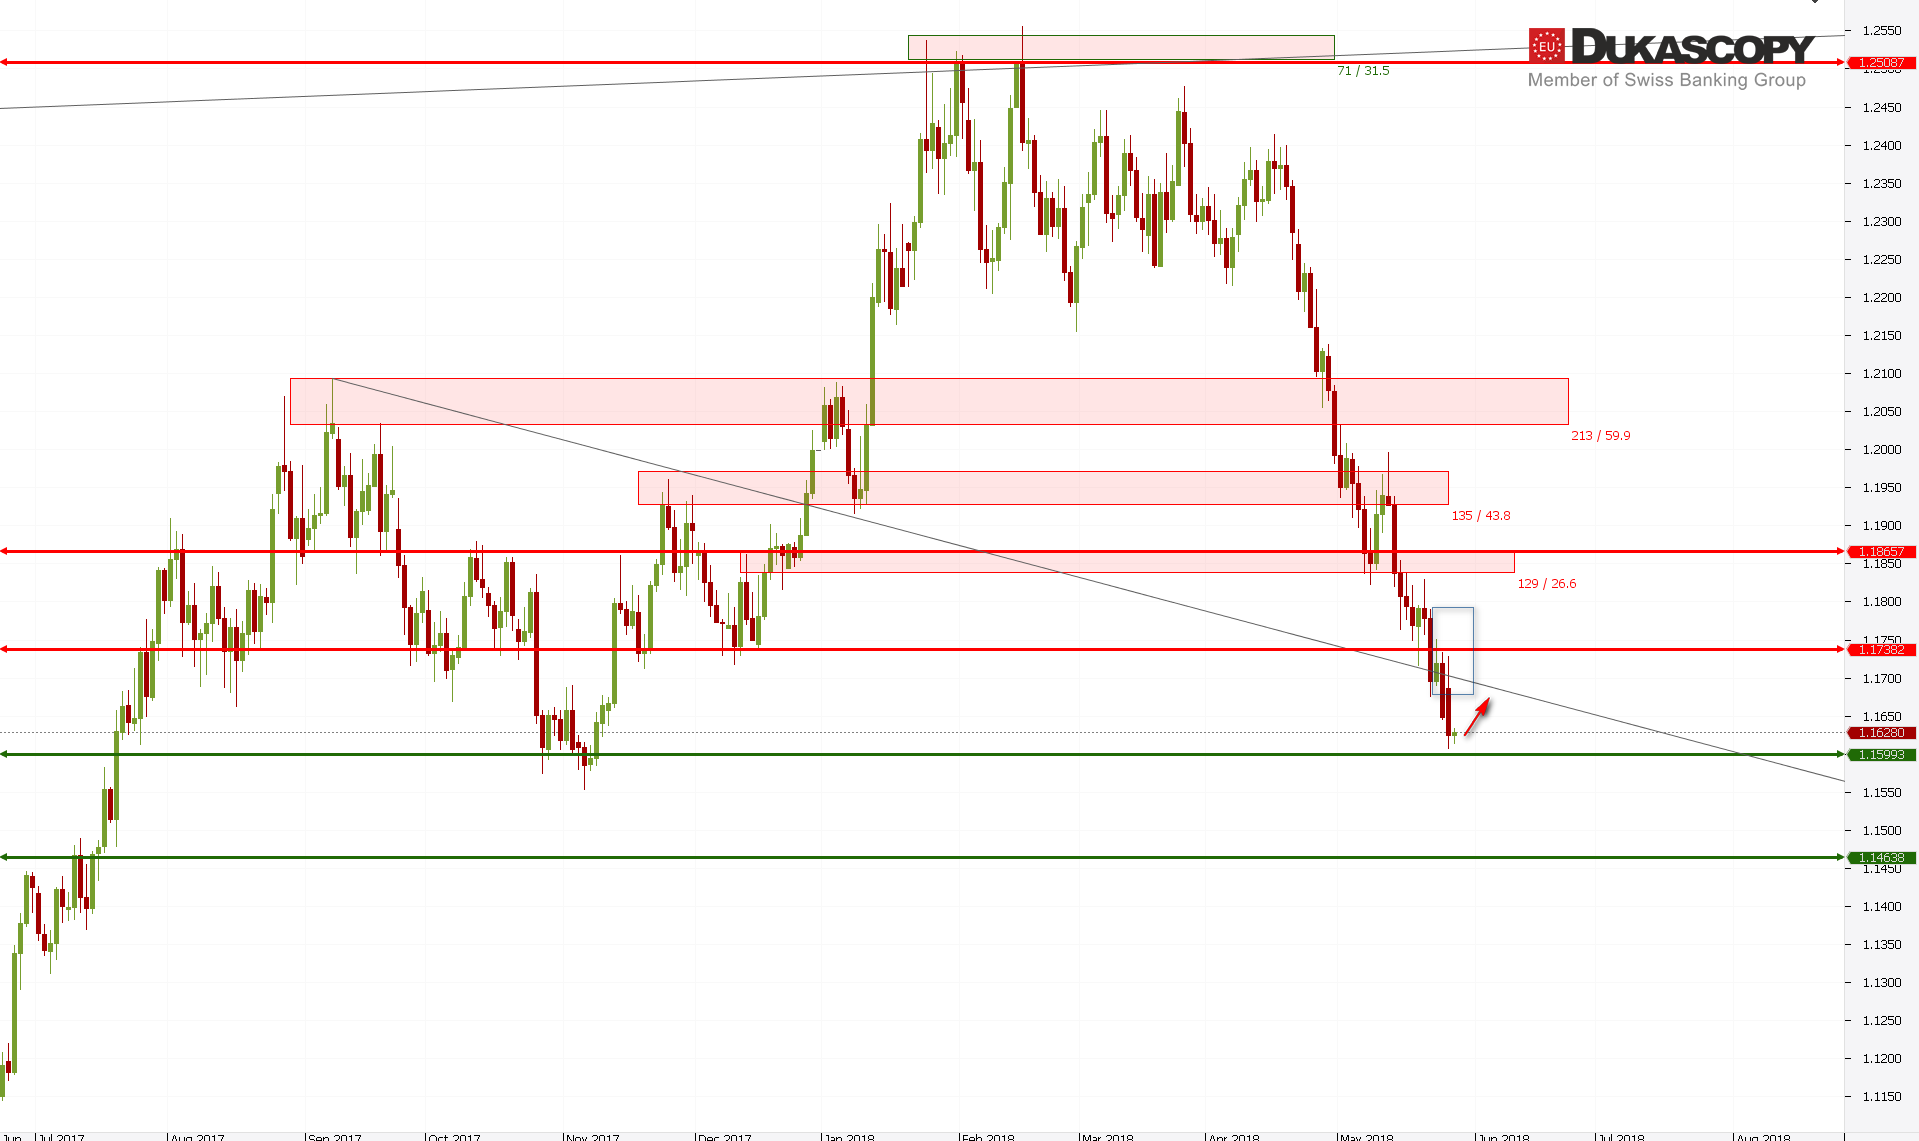
EUR/USD broke the bottom of the Inside Bar which was created just below the resistance zone. Yesterday we watched the re-test of the resistance and internal line, and the lower limit of the IB. The declines reached the next demand zone, precisely to its upper limit. We are waiting for a reaction. If it appears, the increases should test the internal resistance line again. Overcoming the support opens the way towards 1.1460.
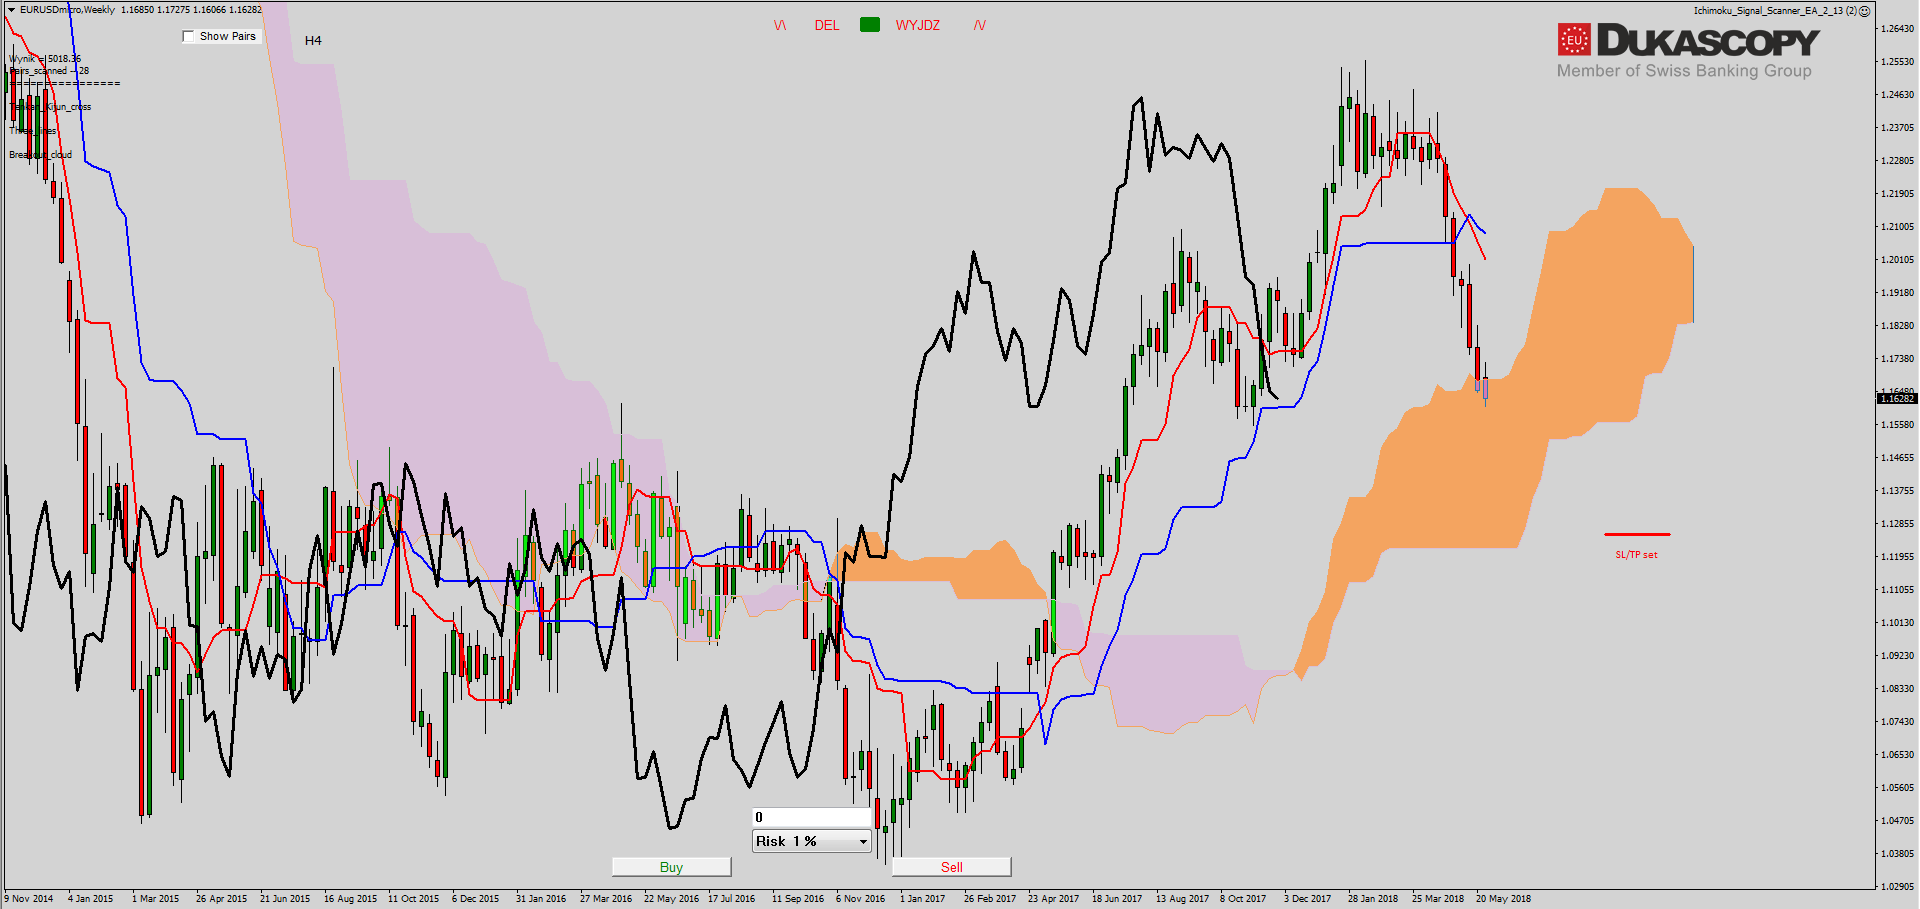
On the Ichimoku weekly chart, we see that the pair is trying to break the Senkou Span A line of growth. If the candle closes under it, we should see the continuation of the falls. For this to happen, the Chikou line has to defeat the Kijun line, which has just stood in its way.
The partner of “Search, Analyse, Trade” series is a Dukascopy Europe broker who gives its customers access to ECN accounts in different currencies.
Trade on Forex, indices and commodities thanks to Swiss FX & CFD Marketplace. Open free trading account right now.
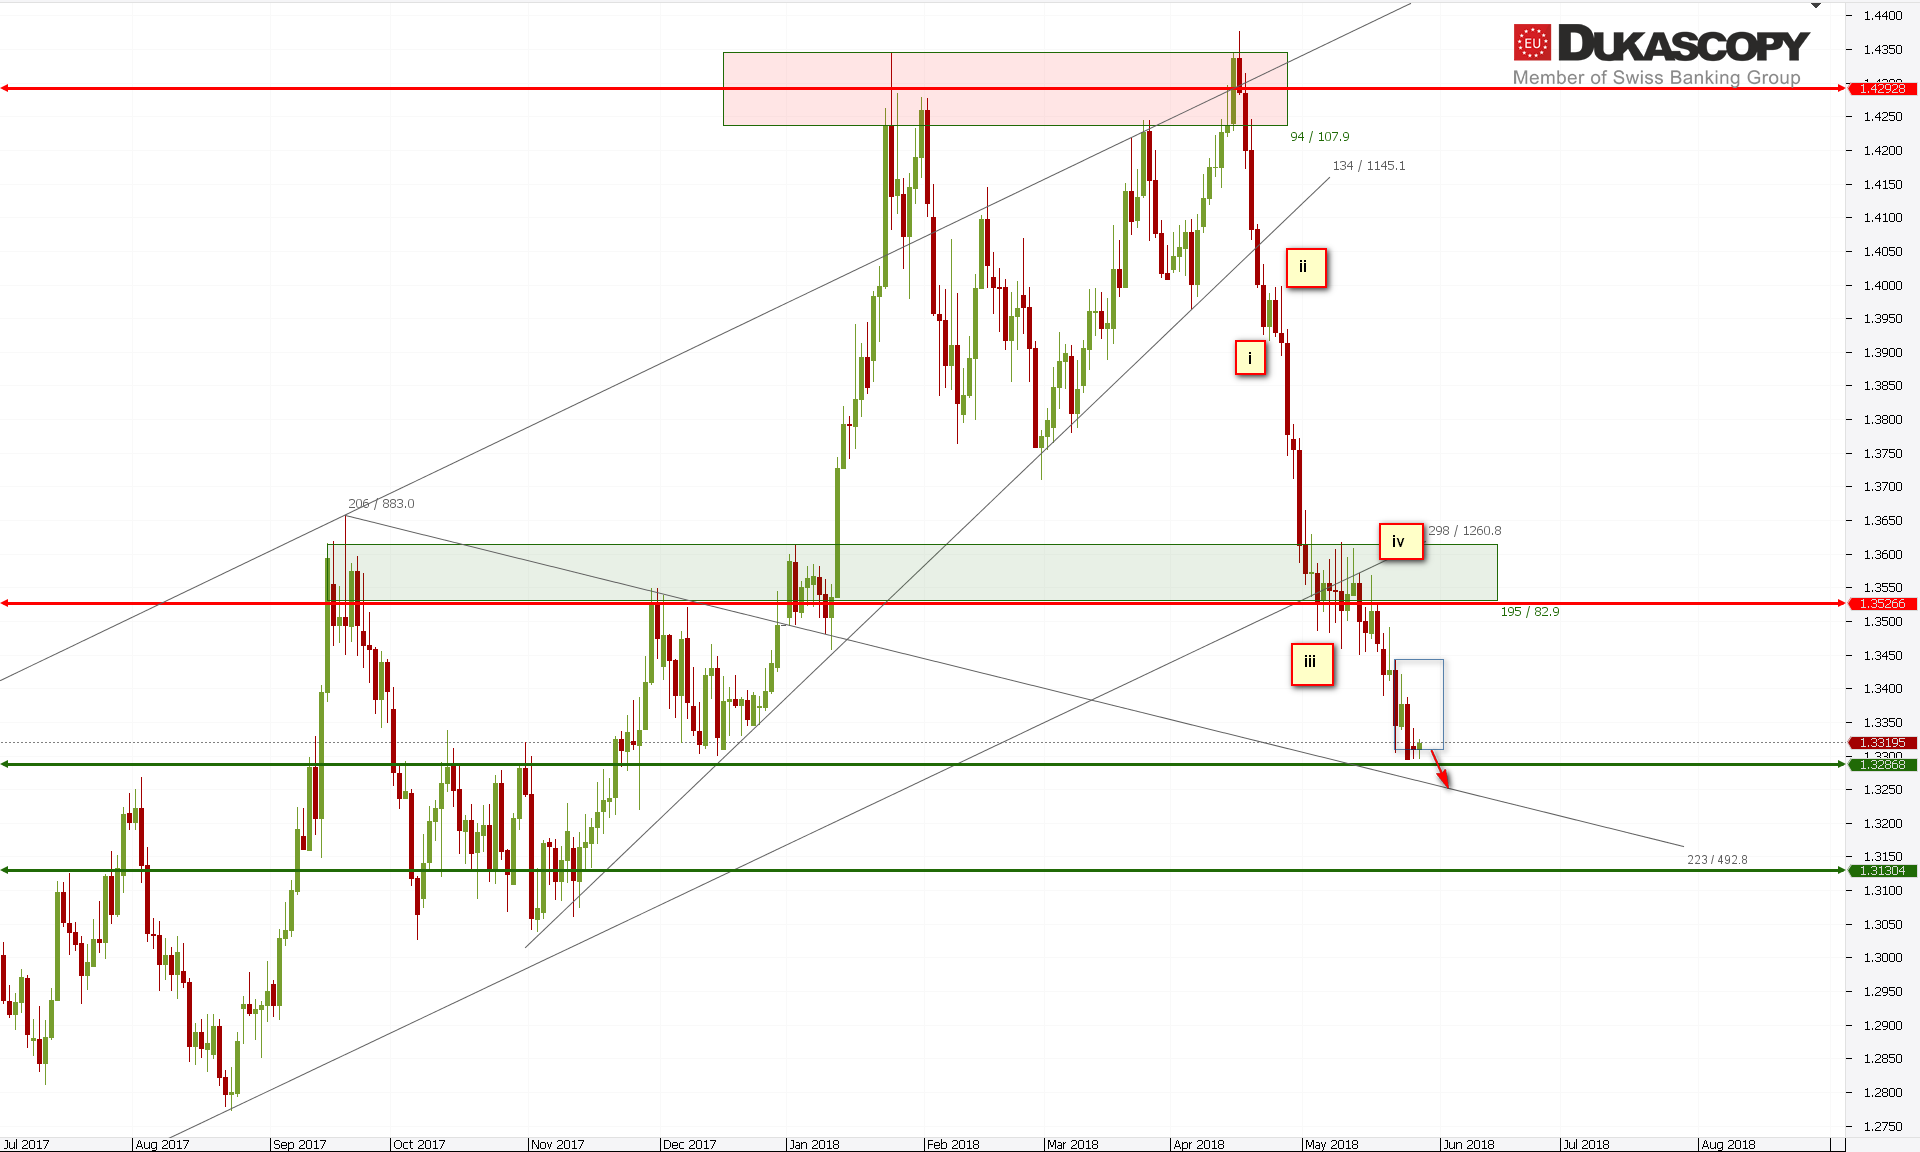
GBP/USD pair is trying to break down from the recently formed Inside Bar. This will be tantamount to overcoming the lower limit of the support zone. The pair still has an internal support line to overcome. Its defeat will open the way towards level 1.3140. However, if you look at the graph in terms of waves, you can see that all the time the fifth wave is being built and if it is not prolonged it should slowly come to end. Now we should be in its third wave, and the reflection from the mentioned support will allow for the construction of the fourth wave.

 On the Ichimoku weekly chart, we see that the pair slowly reaches the Senkou Span A line, which coincides with the lower limit of the support zone. If I had to choose the ending of the declining sequence, this place would be perfect in every way. However, if the pair defeats the SSA, the path to the lower levels will be opened, and the fifth wave will be extended.
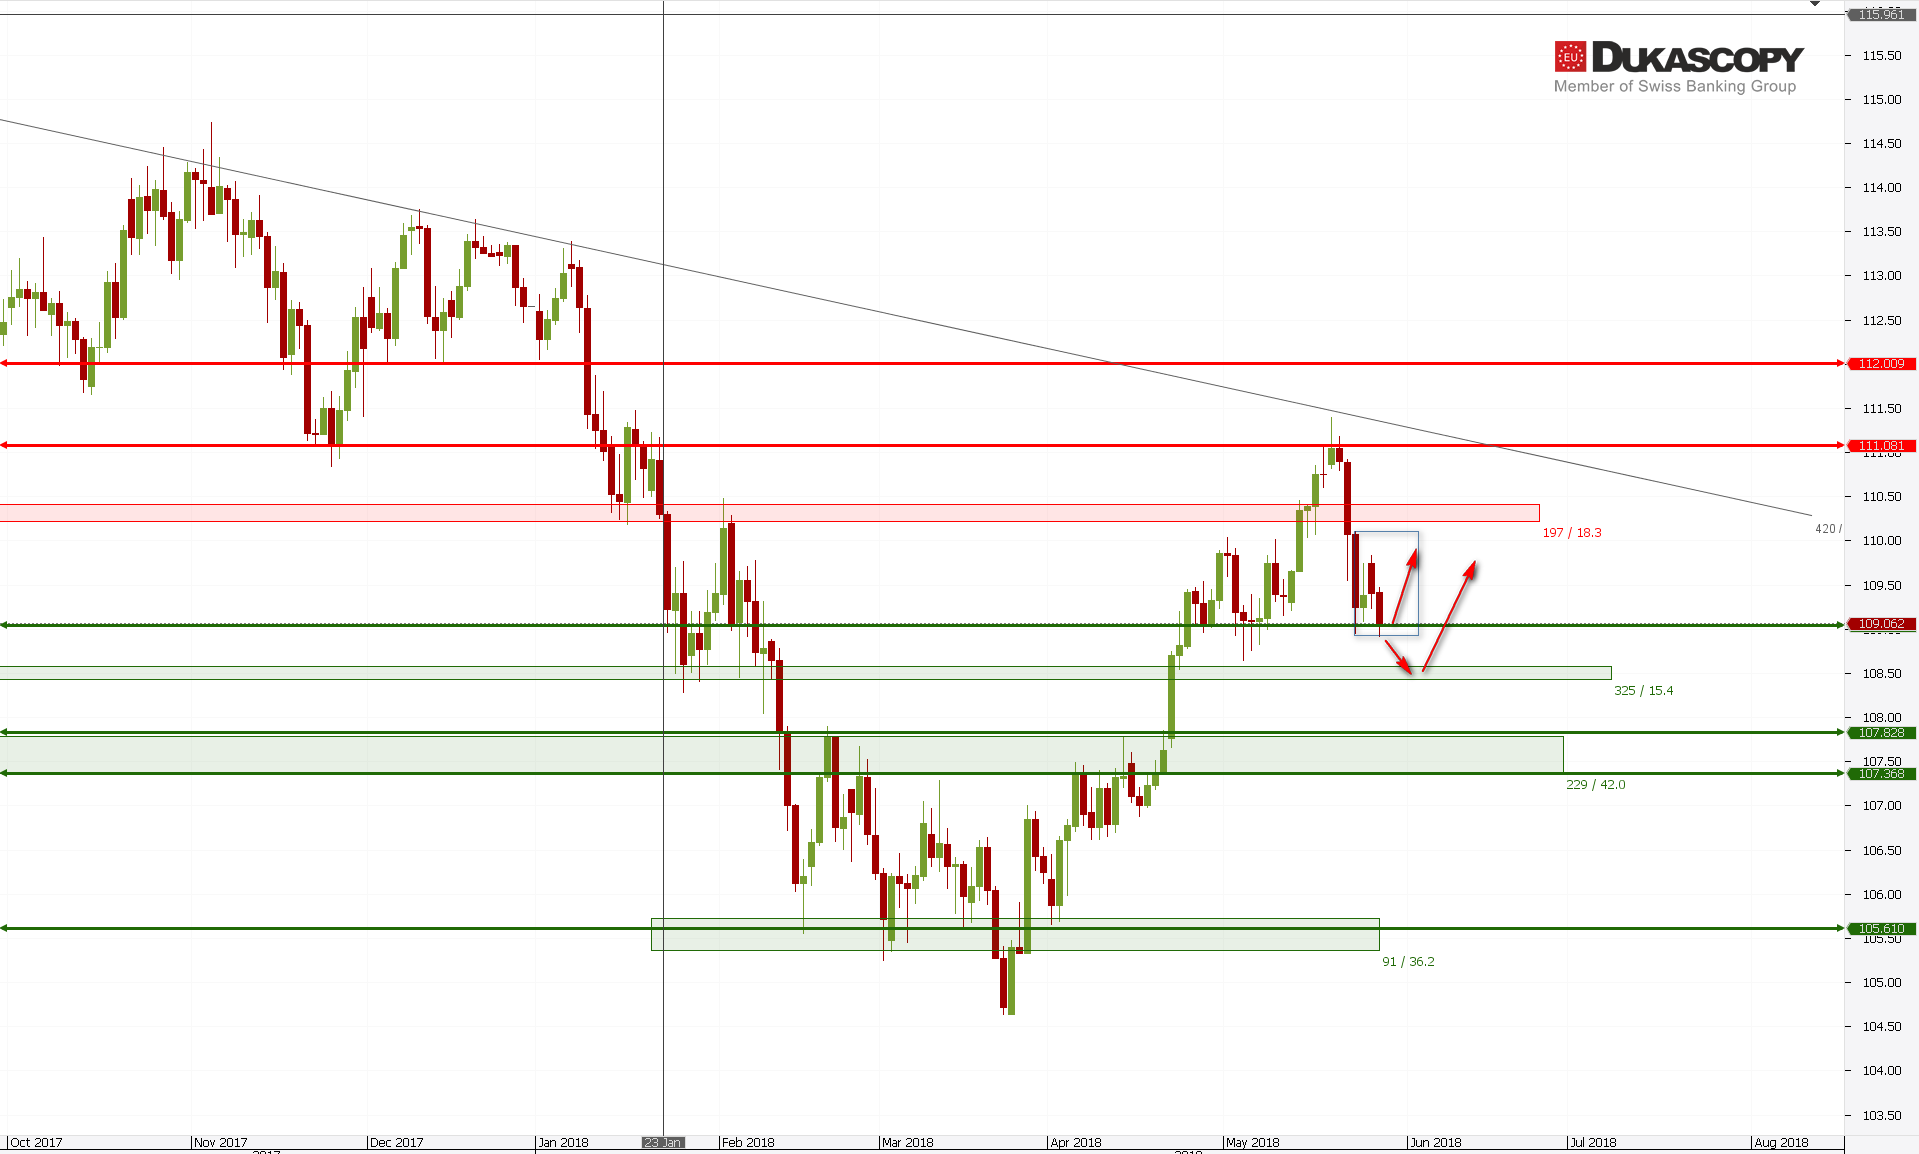
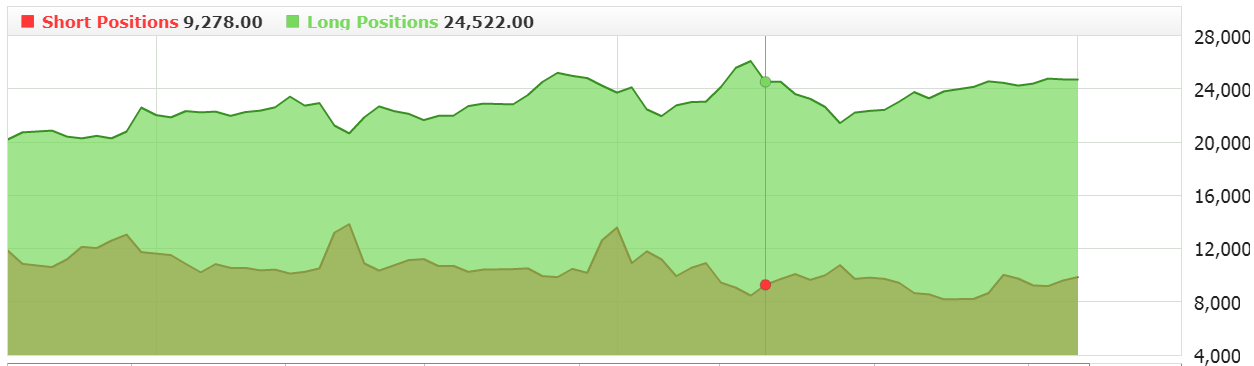
USD/JPY rate still remains inside Inside Bar just above the upper limit of the support zone. I see two possible scenarios here. The first one assumes a reflection from the support and lower IB limit or drawing of a Fakey formation and the upward movement towards the upper limit of IB, i.e. the construction of the right arm of the head and shoulders formation. In the second one, the pair overcomes the mentioned levels and builds a downward wave of 3C.
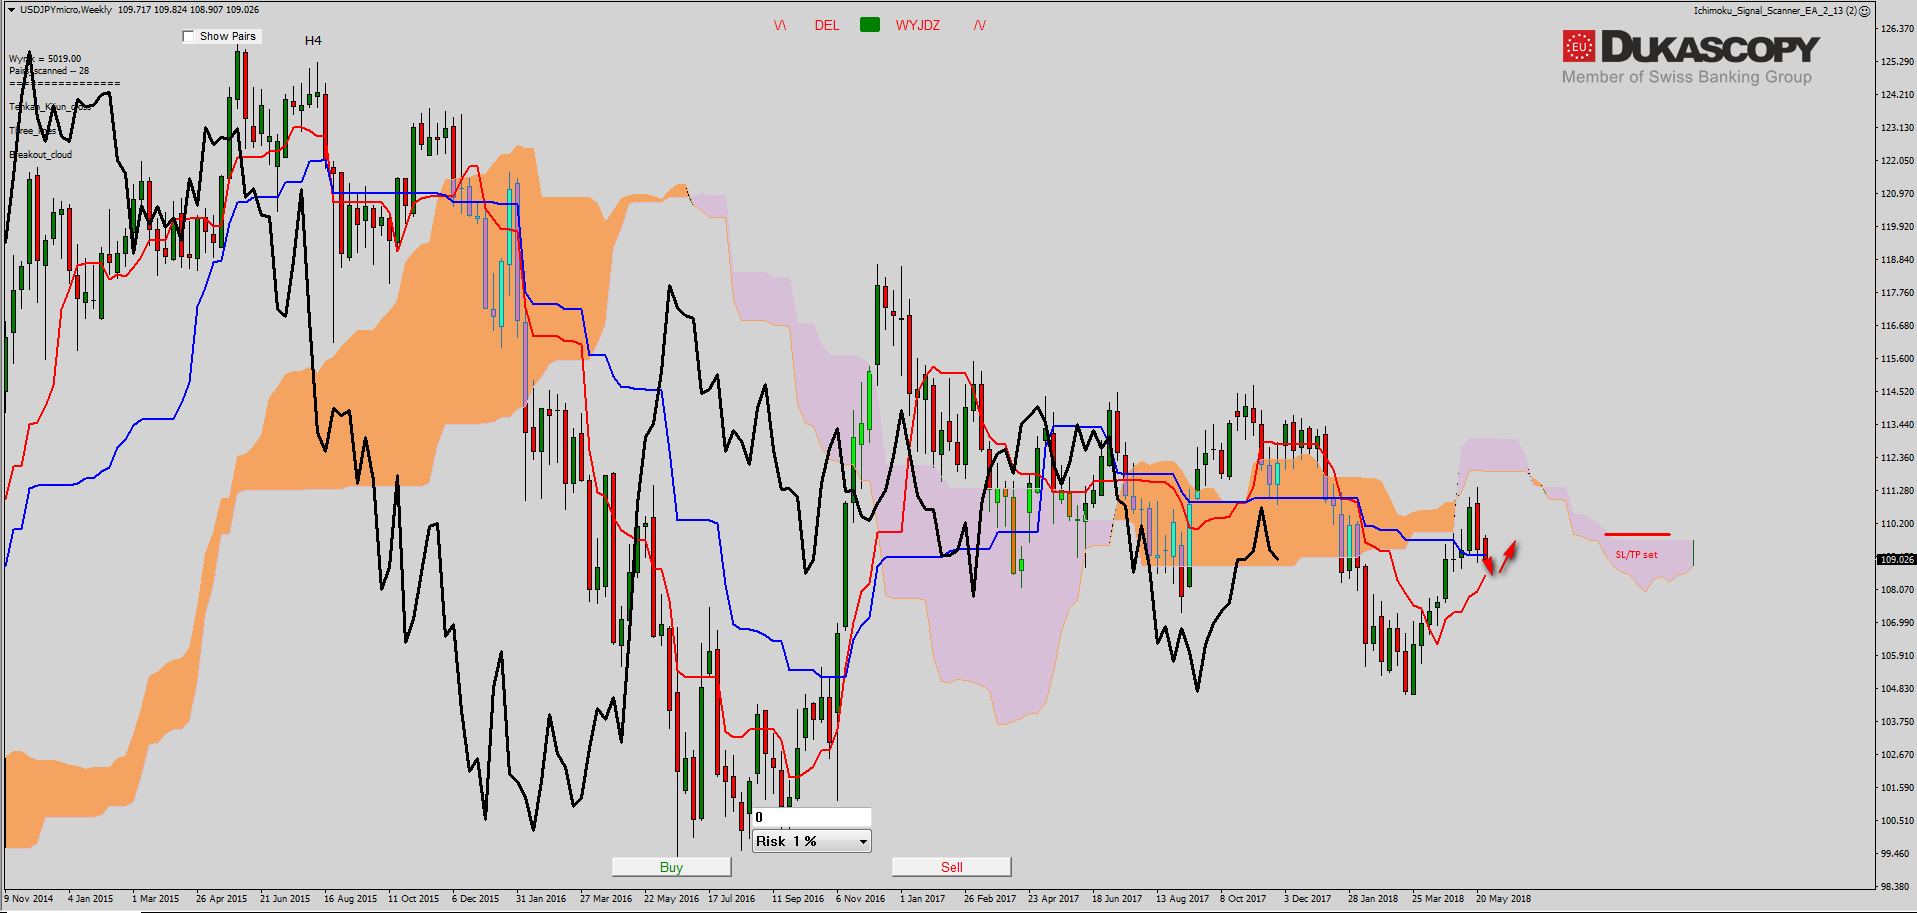
On the Ichimoku chart, we can see that the pair is fighting with Kijun. Its overcoming should lead to the Tenakn line test and there it will be decided that the observed drop is just a local correction or something bigger.


 Review")


