This week I have published analyses of two currency pairs, GBPNZD and EURUSD. Let us compare the theory from the analyses with what real market have done.
Monday’s analysis: “GBPNZD – bullish divergence on H4” turned out to be very accurate. I wrote in it, among other things: “Looking at chart H4, we can see that there is an upward divergence and the price is heading north. The likely target for demand will be level 1.8510, where the nearest local supply zone is located, and after successfully overcoming it the level of support/resistance 1.8600.”

If we look at the graph comparing the situation on Monday and the current one, we can say that the plan was executed with a surplus, the price after overcoming the resistance on 1.8600 reached 1.8625. Currently, divergence on H4 has already ended and the overcome resistance (1.86) may be a support for the falling price.
The second analysis of the week, which was published on Friday after the ECB meeting: The “EURUSD – bullish engulfing in the daily chart” assumes an increase in this pair after the breakout from the pattern. So far the breakout has not happened, we have to wait until next week for the market to make a significant move before verifying the analysis.
AUDCAD 11-27.07.2019
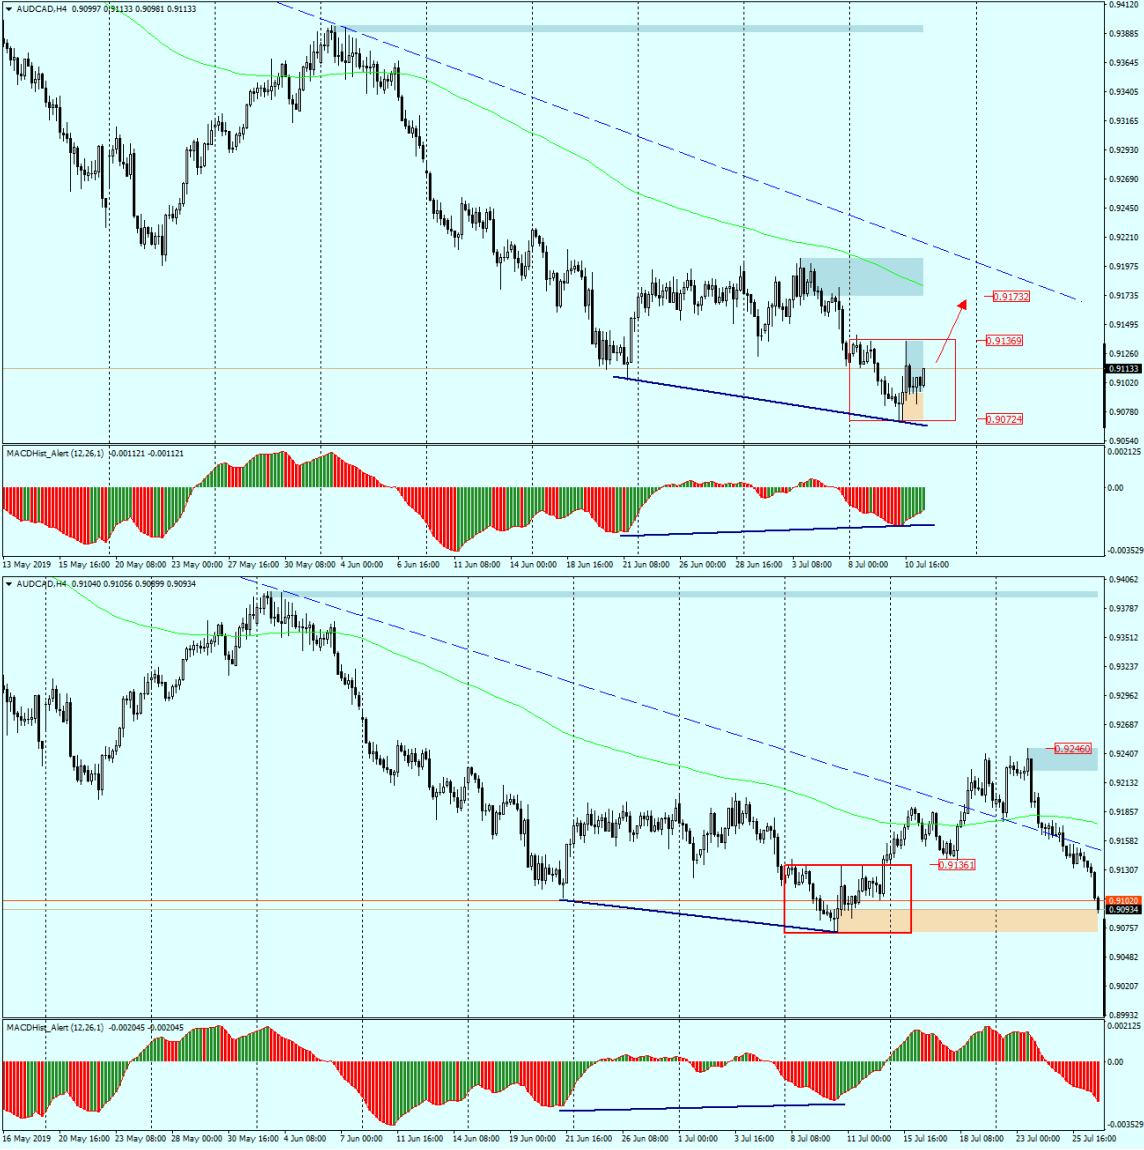
It is worth returning to the analysis of the 11th of July of the pair “AUDCAD – divergence and bullish engulfing on daily chart”. – Here the situation has developed quite dynamically and the above chart confirms the effectiveness of a two-candlestick pattern, i.e. bullish engulfing combined with upward divergence between price and MACD.
 In our Facebook group, which you can join anytime: https://www.facebook.com/groups/328412937935363/ you will find 5 simple strategies on which my trading is based. There, every day we post fresh analyses of currency pairs and commodities


 Review")


