The exchange rate of the USDCHF is moving in an upward trend, with lows and highs at ever higher levels. This month the buyers managed to overcome a key resistance close to 0.9988 and then the quotations set a high at 1.0097.
As can be seen in the daily chart below, a correction began following the setting-up of the high. Now the USD/CHF exchange rate is just above the previous resistance with 0.9988 (previously support) and in the average channel EMA 10/20, which creates dynamic support.
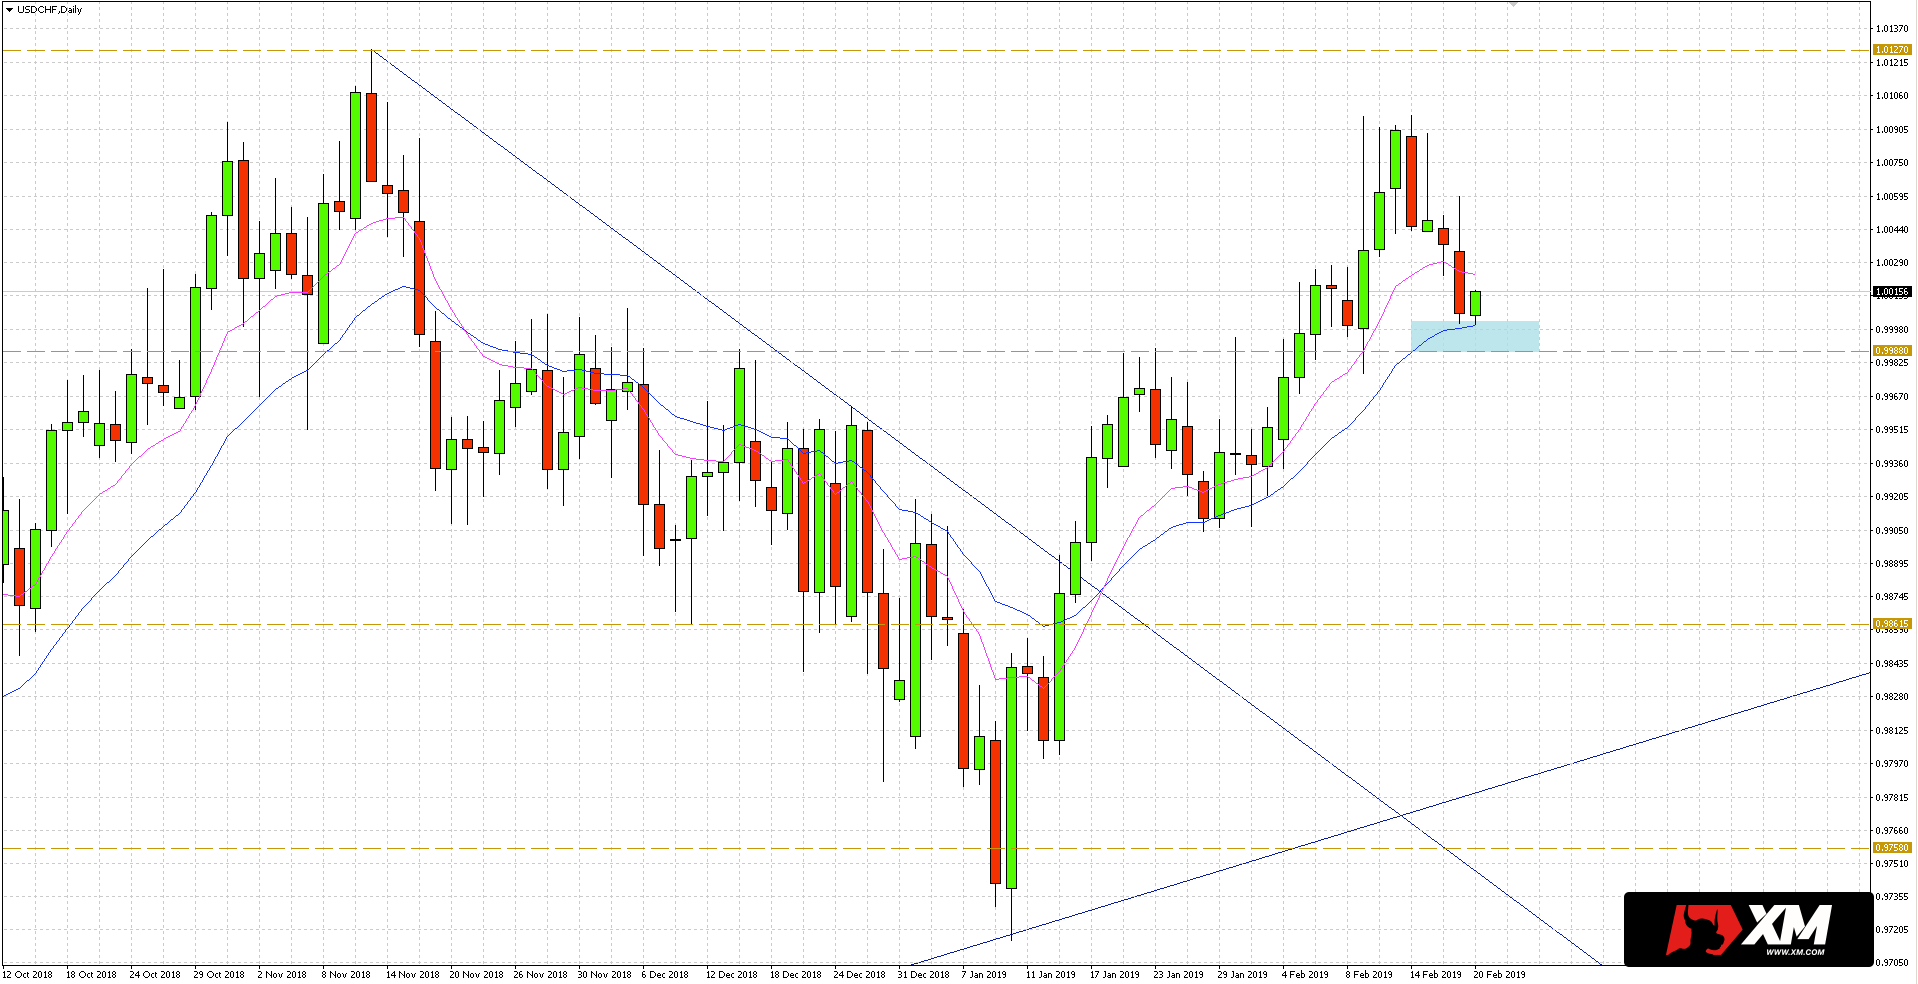
The Tuesday daily candle created a bearish engulfing pattern, in this case a continuation sign.
What matters now is how price action will roll out on support. If there is a correct buy signal from the daily chart, traders will be able to consider buying from the support.
Alternatively, breaking the 0.9988 level would open the way to the next level of defence around 0.9907, which stopped sellers in the second half of January this year.
Join us in our new group, free from scam and annoying advertisements, dedicated to serious traders, get fresh analyses and educational stuff here: https://www.facebook.com/groups/328412937935363/


 Review")


