As in the title: on USDJPY a bullish engulfing pattern was formed yesterday on the daily chart, but the behavior of the price and MACD oscillator indicates the possibility of continuing decreases, which is another example that the future fate of this pair will depend on the direction of the breakout from the pattern and its location on the chart, and not on its name resulting from the type of candle that is engulfing, in this case the bullish candle.
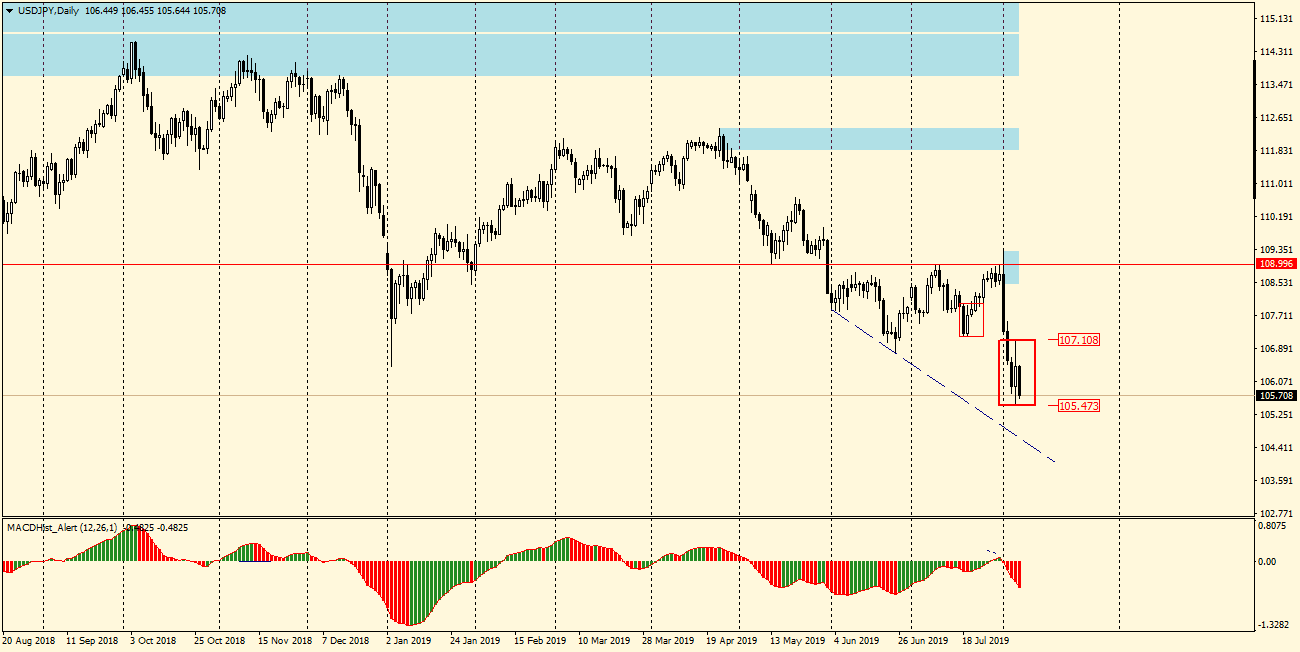
In order to take the correct (in our concept profitable) position, we have to wait for the direction in which the Outside Bar will be broken and until the MACD sets a minimum, i.e. it will continue to decrease (red), let’s set ourselves for the continuation of decreases. However, in the case of a breakout thru the top and a change of sentiment to MACD (green), we can plan the longs.
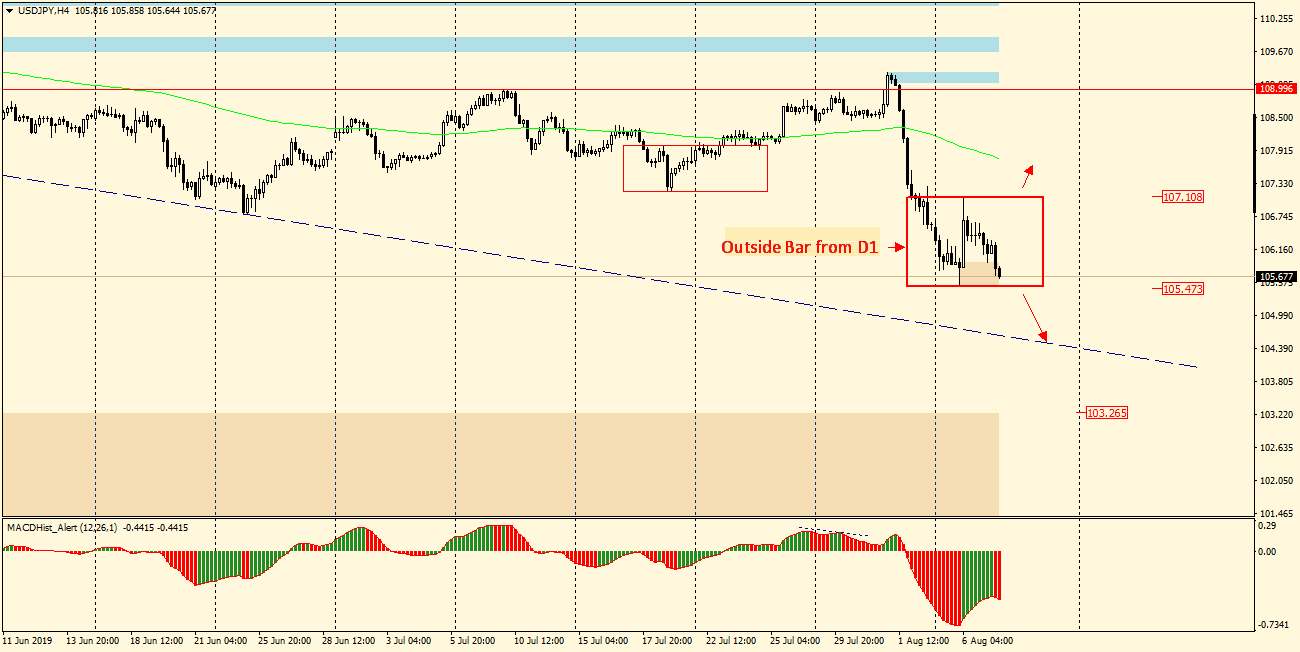
If we look at chart H4, we can initially determine the range of falls (in the case of a down break) to the blue trend line, which is currently at the level of 104.65.
 In our Facebook group, which you can join anytime: https://www.facebook.com/groups/328412937935363/ you will find 5 simple strategies on which my trading is based. There, every day we post fresh analyses of currency pairs and commodities


 Review")


