 Weekend is good for a summary of the passing week. I compare my analyses (theory) with what the real market (practice) had done on two pairs GBPUSD and USDJPY.
GBPUSD 05-10.08.2019
In Monday’s analysis: “GBPUSD – bullish divergence gives hope for an upward correction” – based on the created Inside Bar and upward divergence on chart H4 I expected a correction and increases at least to support of the wedge from which the price had broke out a week earlier.
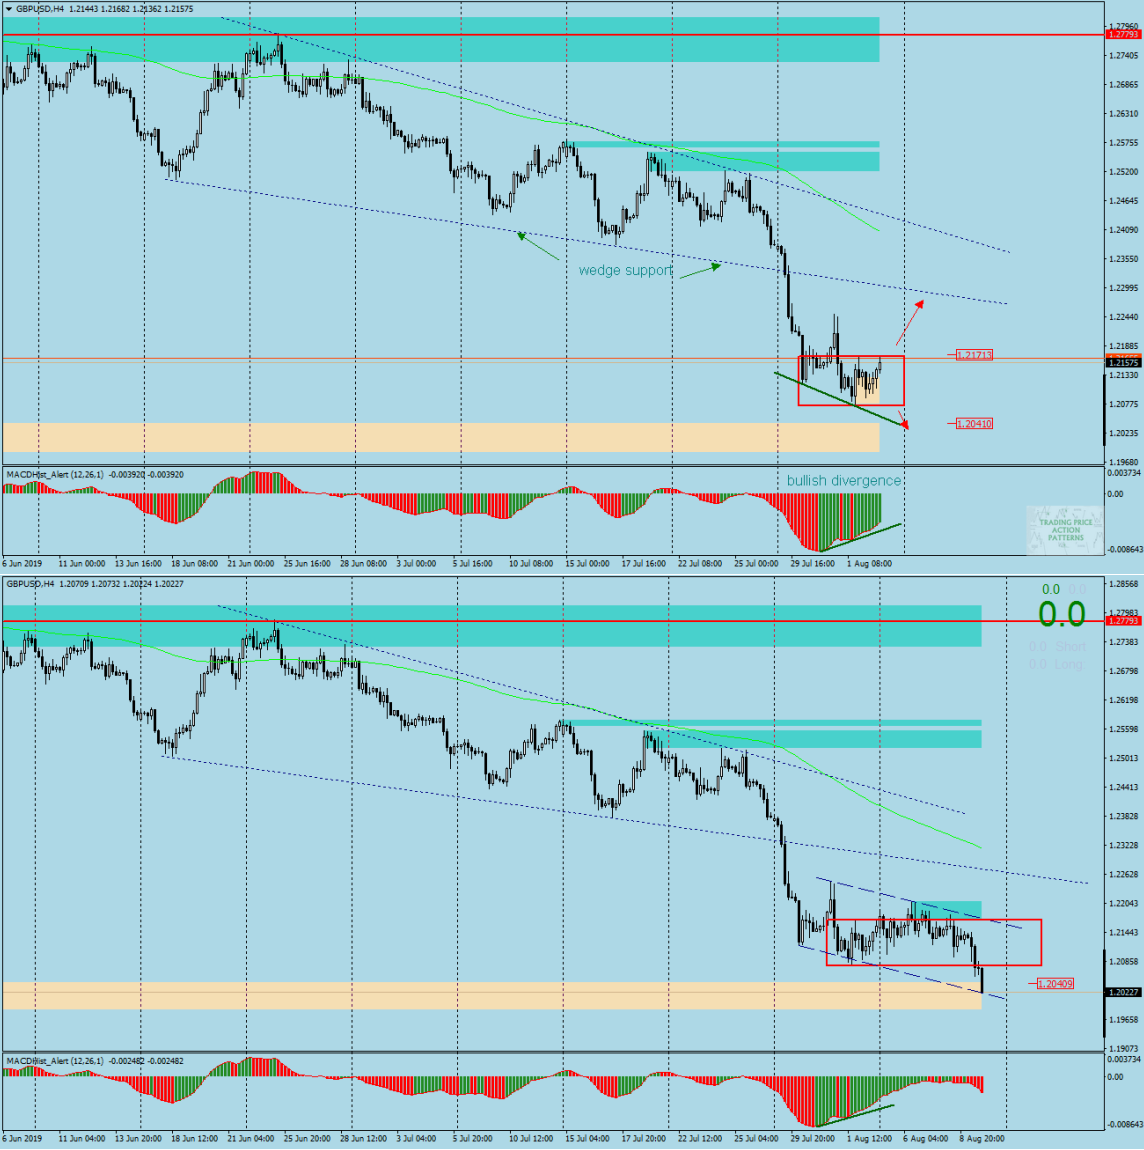
I wrote this: “When you go to chart H4 you can see that there is a bullish divergence that supports a daily interval growth scenario. If there is a breakout and the MACD starts to rise on D1, it will be an opportunity to open a buy order. The target of the demand can be the support of the downward wedge that the price left, very dynamically, at the beginning of last week.In case of a possible bottom breakout, the price may stop at the demand zone which begins at the level of 1.2040.”
The market, however, had a different idea for this pair and after a few days staying in the IB and unsuccessful attempts to break out thru the top, finally on Friday it broke through the bottom and even a strong demand zone starting at 1.2040 could not stop the sellers. Undoubtedly, such strong falls were caused by weak economic performance in the UK, including the first time since 2012 that the UK’s Gross Domestic Product fell by 0.2% q/q in the second quarter of 2019. The price has already reached 1.2020 and there is little to set a minimum of all time, which is from 15.01.2017 at 1.1985.
USDJPY H4 07-10.08.2019
The second analysis of this week was about the pair: “USDJPY – bullish engulfing on D1 but sentiment still bearish”.
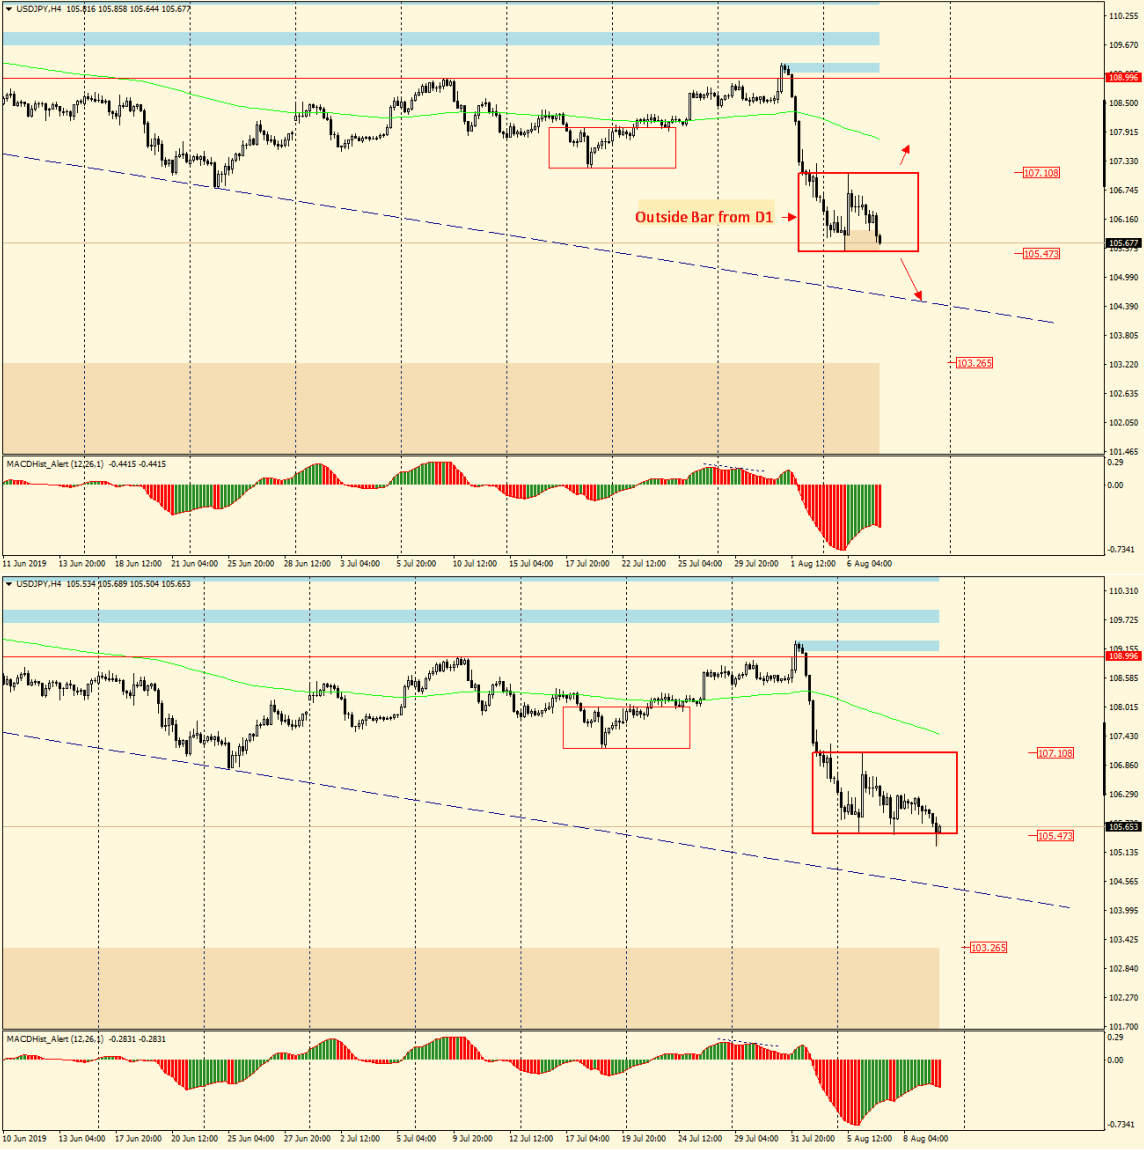
I wrote this:” (…) on USDJPY a bullish engulfing pattern was formed yesterday on the daily chart, but the behavior of the price and MACD oscillator indicates the possibility of continuing decreases, which is another example that the future fate of this pair will depend on the direction of the breakout from the pattern and its location on the chart, and not on its name resulting from the type of candle that is engulfing, in this case the bullish candle”
The market has not decided in which direction the quotes should go until the end of the week, the price has still not gone beyond the range of the bullish engulfing formation. The MACD on the daily chart is still “red”, so I am still more confident that the price will fall.
 In our Facebook group, which you can join anytime: https://www.facebook.com/groups/328412937935363/ you will find 5 simple strategies on which my trading is based. There, every day we post fresh analyses of currency pairs and commodities


 Review")


