Looking at the weekly pound sterling (GBP) chart against the New Zealand Dollar (NZD), the test of the support area at 1.8275 is obvious, where we have the minima from the previous week.
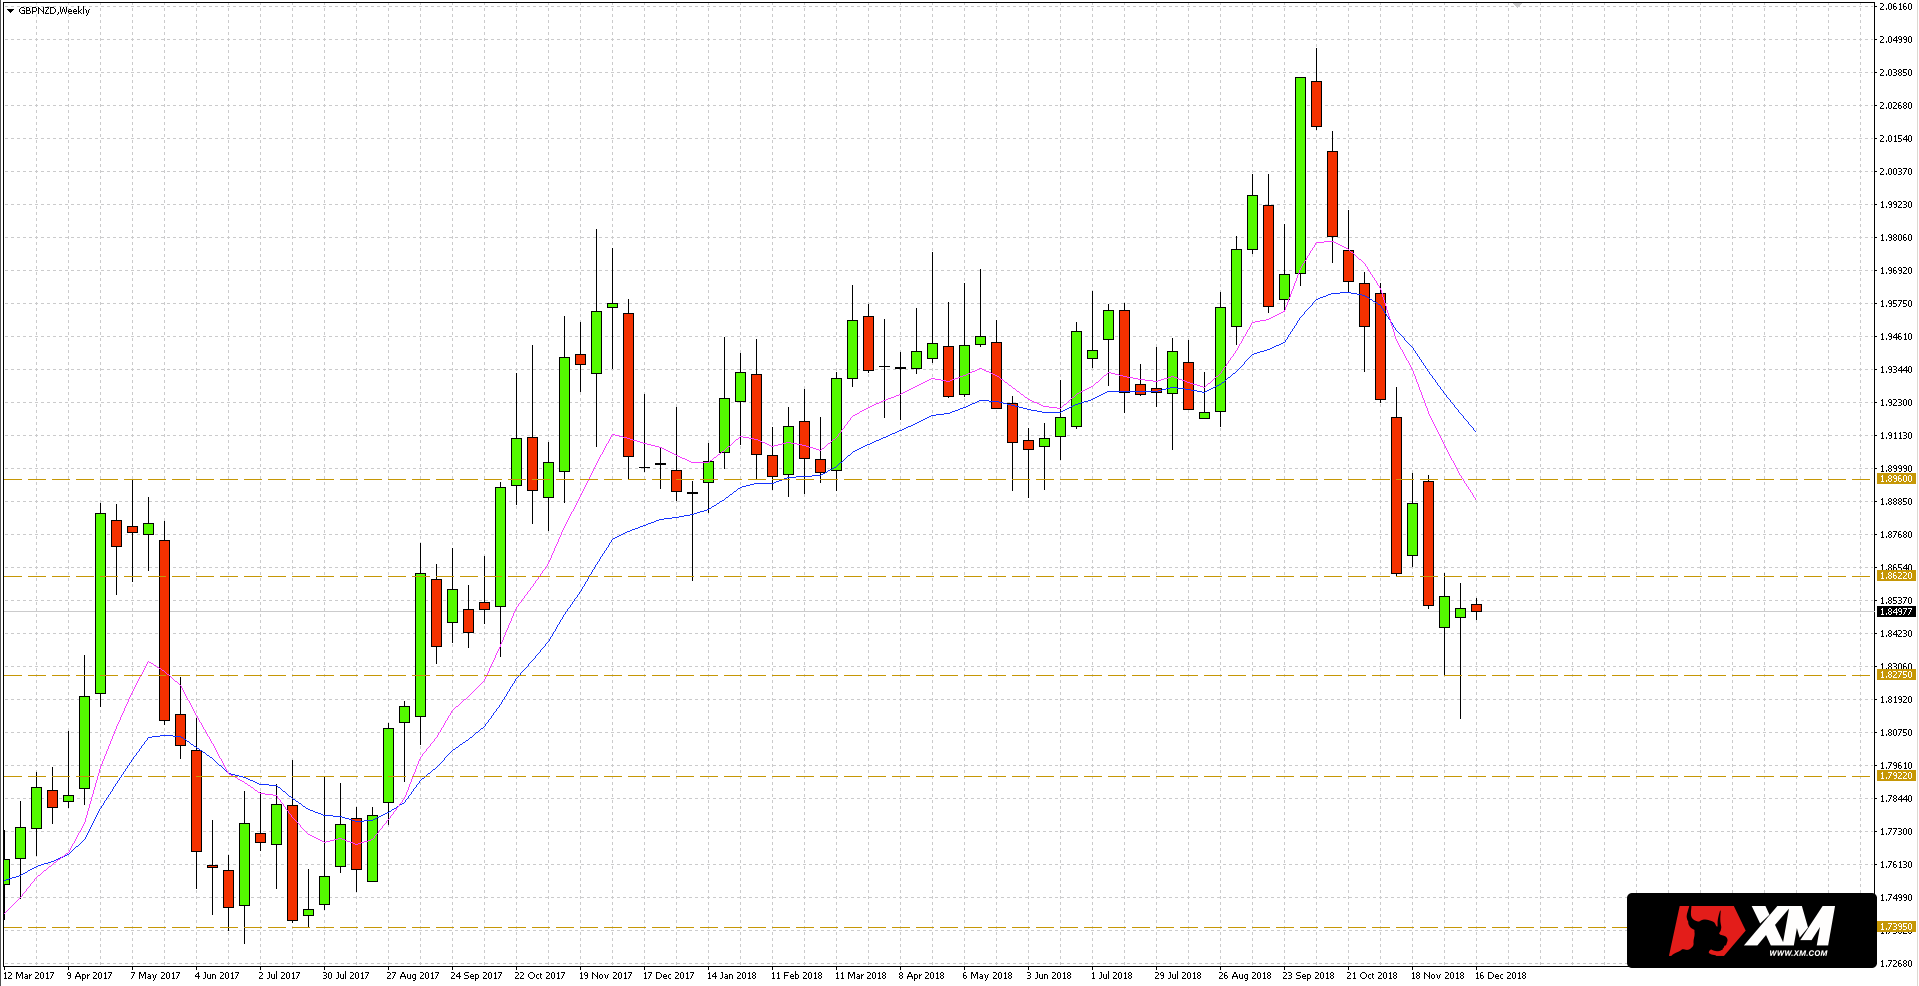
Despite the initial slump at the beginning of the week, the pair on Friday has done the whole loss. This led to the creation of a candle with a long shadow at the bottom indicating the victory of the demand side. However, what next?
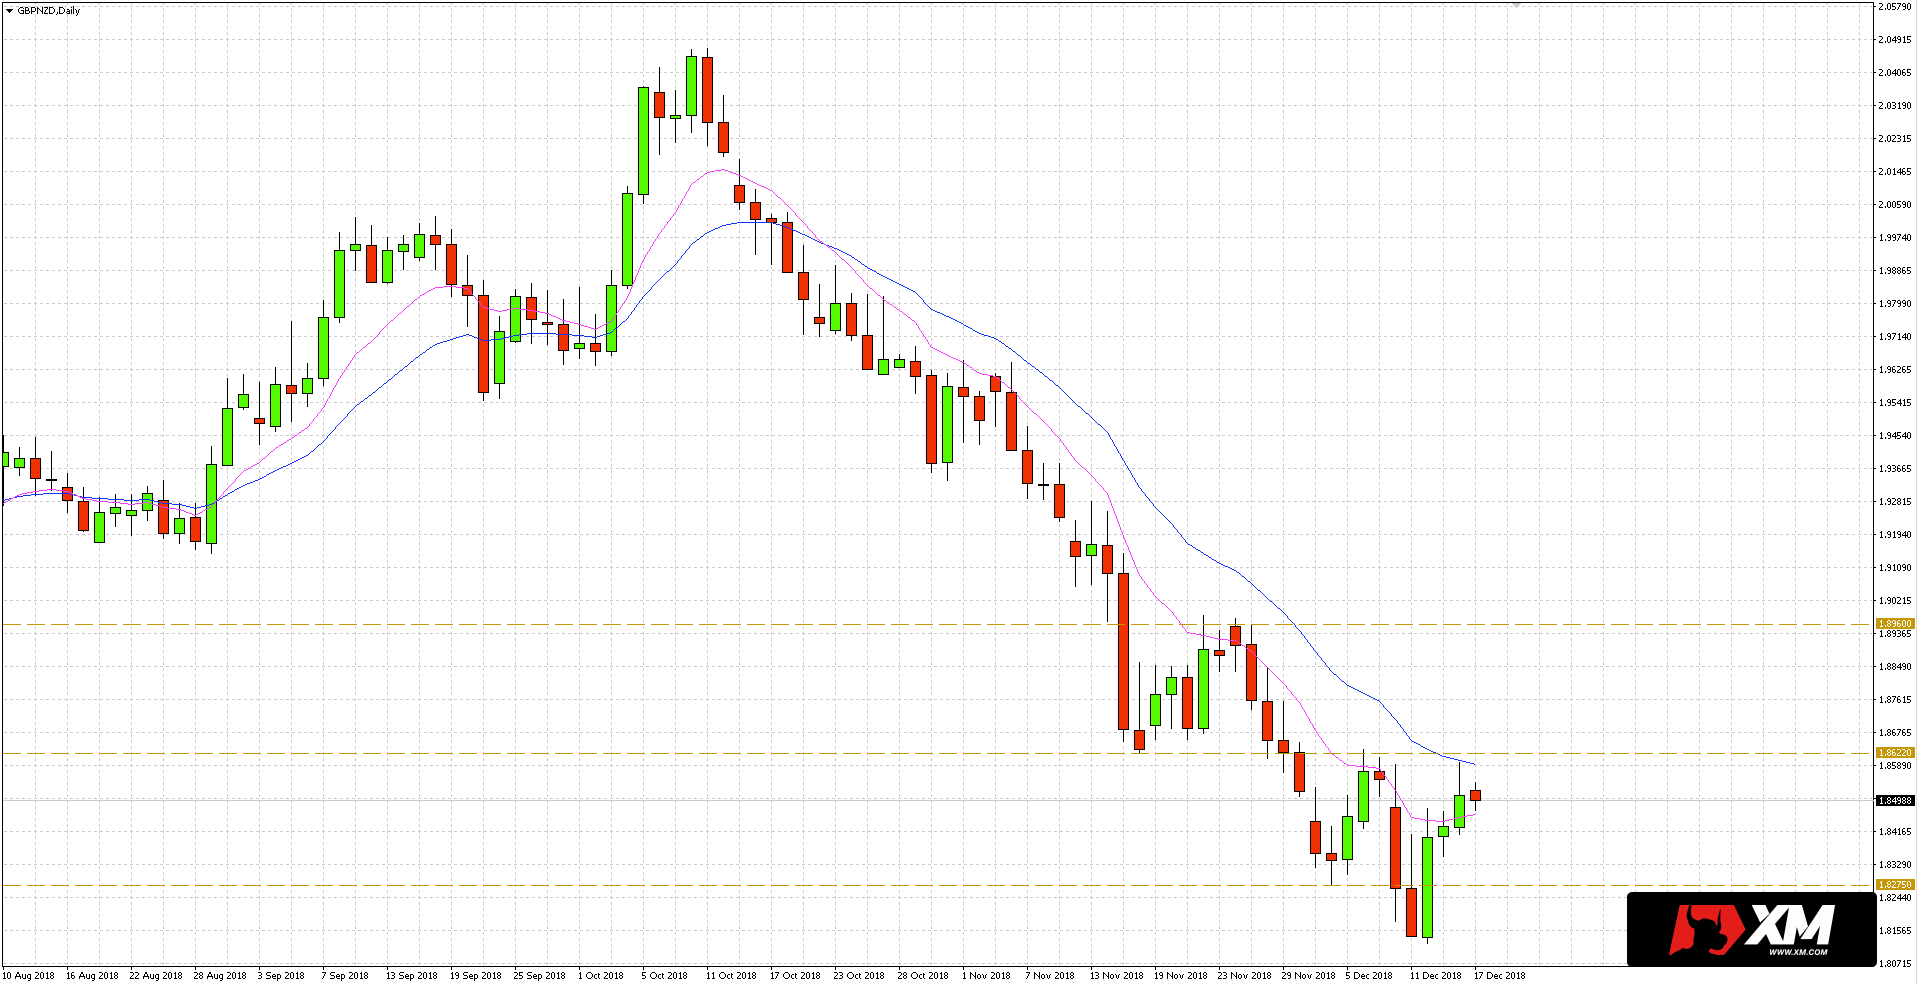
After switching to the GBP/NZD daily chart, we see that the rate after the rebound has reached the confluence zone, where the horizontal level of 1.8622 coincides with the average EMA10/20 channel , which provide dynamic resistance. The relevance of the test is therefore important. If it turns out to be positive, support will be revealed again (1.8275) and last week’s minimum (1.8123). Alternatively, the effective breaking of the resistance confluence will question the ongoing downward trend and open the way for another resistance at 1.8960.


 Review")


